5. Tutorial 5
5.1. Purpose
The purpose of this fifth tutorial is to cover the dashboard usage of the GMT - this is mainly aimed at people who will be monitoring the data quality and the microplanning progress.
No prior knowledge will be needed. This is not structured as a tutorial in the sense that you will have to perform actions. Rather, we will cover each section step by step.
The following will be covered:
Getting started with the GMT
Dashboard data and statistics tab
Attention tab
Exporting data
Resetting Microplanning
5.1.1. Getting started with the GMT
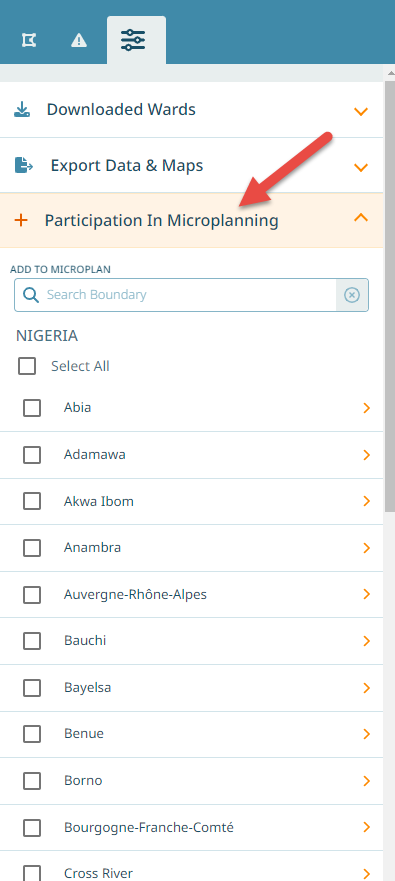
When the country starts GMT implementation, it will not deploy the GMT in all regions at once. Rather, this will be a step-wise process. Thus, we will first have to define what areas are going to use the GMT. Once this has been defined, those areas will have to be activated in GMT. This is why the dashboard shows no data for an areas as long as its participation has not been activated. To activate an area, navigate to the ‘Settings’ tab.
In the section ‘Participation in Microplanning’ you can activate the areas that should participate. Note, once participation has been activated, this region will be considered for microplanning in GMT and the data and statistics will be visible.
Note
This section is role based. A defined set of permissions is needed to enable participation for a boundary.
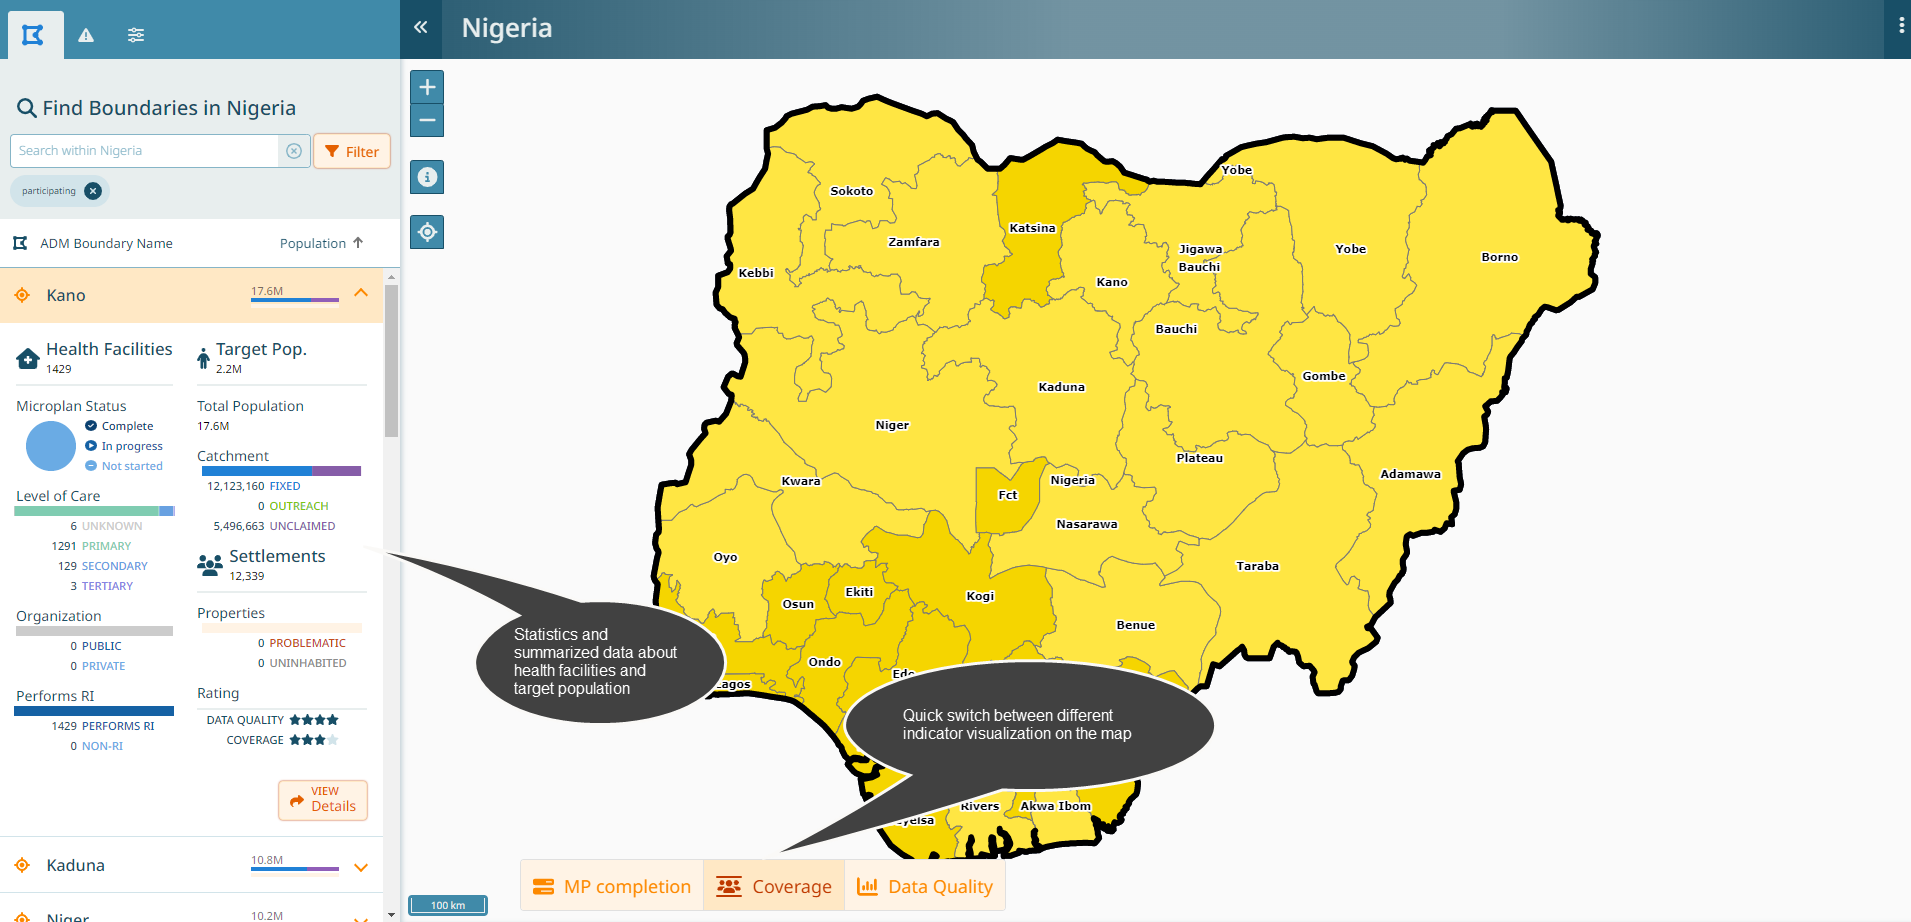
5.1.2. Dashboard data and statistics tab
For all boundaries that have been activated, you have now an overview of:
Health facility statistics and their microplanning status
Total and target population in that boundary
Settlements that require special attention
Coverage by routine immunization strategy (fixed post, outreach)
Basemap quality (number of machine generated names)
Note
Target population corresponds to the routine immunization target group, calculated as follows: * 0-11 months: 3.8% of total population * 12-23 months: 3.5% of total population * Pregnant women: 5% of total population
Important
All dashboard statistics are only updated when data is synchronized. Thus, if the field team is doing microplanning in an area where there is no connectivity, even if they are entering data and updating the microplan, all these changes will only be visible on the dashboard once the synchronization has been performed!
Hint
You can switch between a map that shows microplan completion status, coverage status and data quality status. You can also zoom to different levels to see where the most important areas to focus on are.
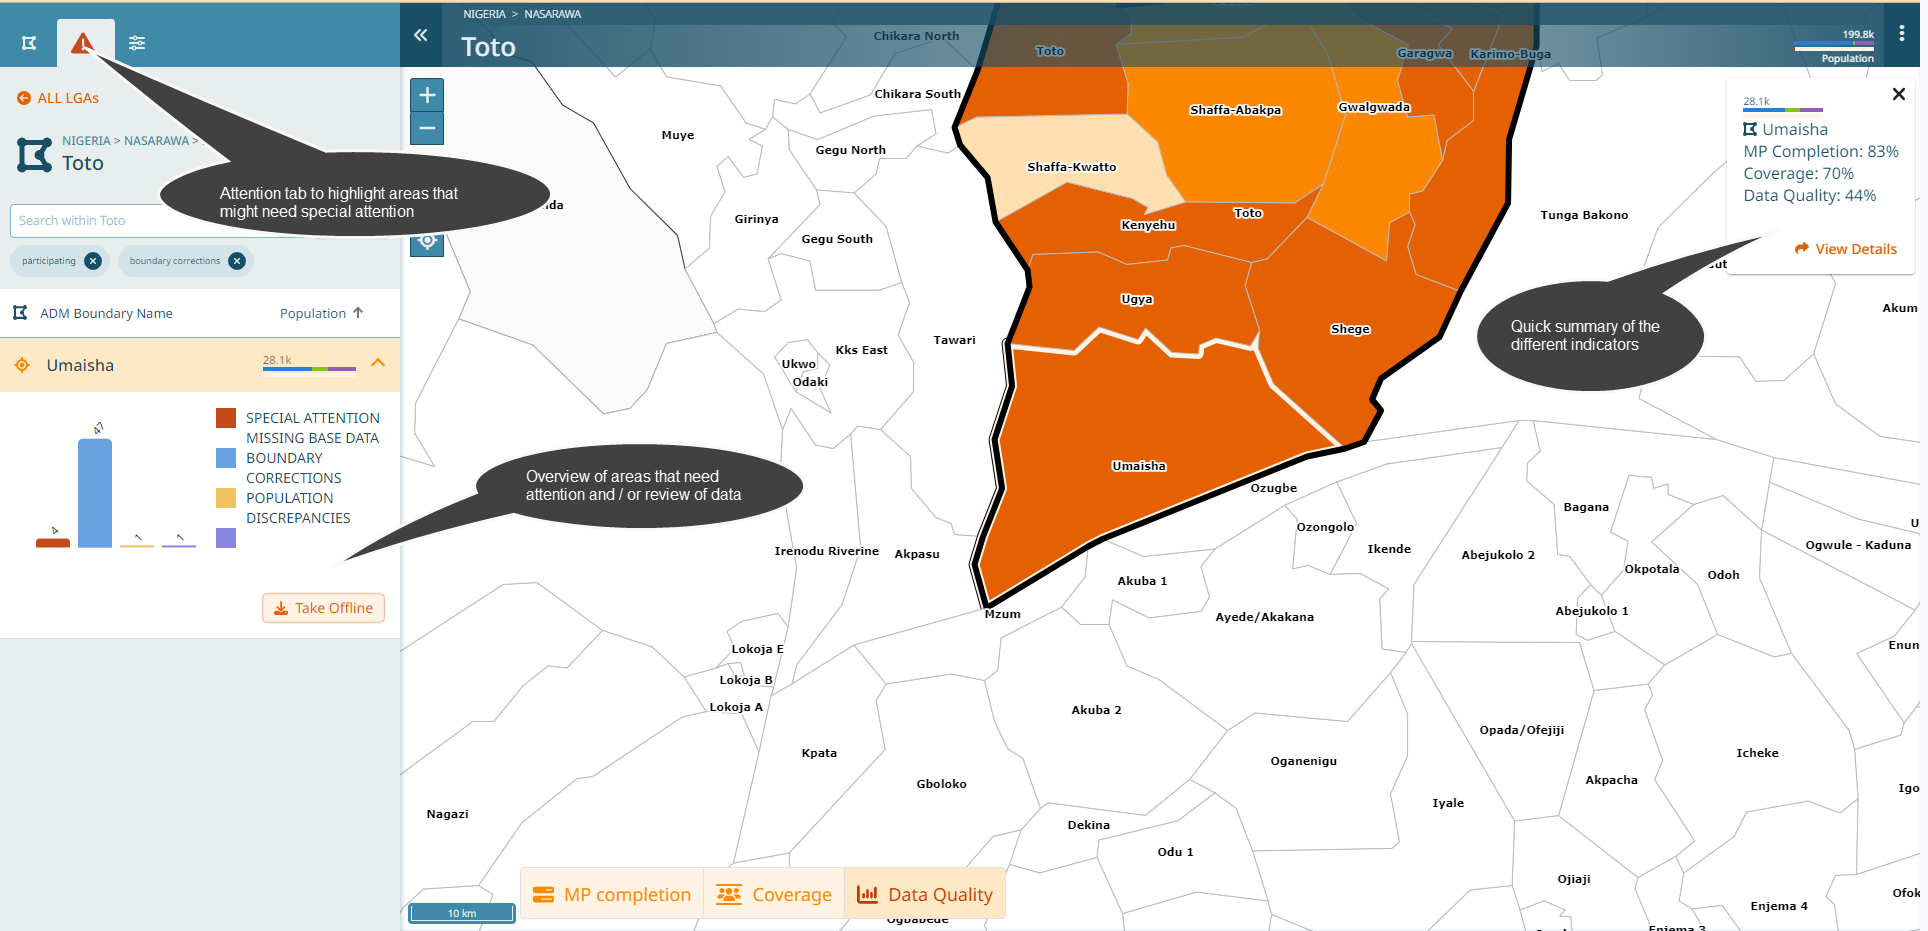
5.1.3. Attention tab
The attention tab gives a quick overview on things that may need to be reviewed and / or need special attention.
Those items are:
Number of settlements that need special attention
Number of machine generated names remaining
Number of Ward boundary changes
Number of settlement with population discrepancies
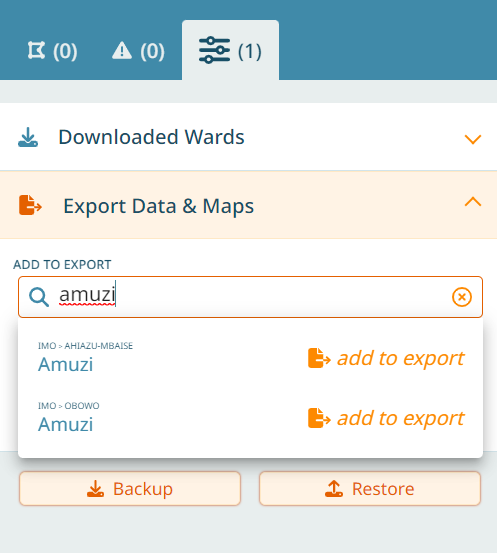
5.1.4. Exporting data
From the GMT, there are a set of exports that can be obtained.
A PDF map of the microplan
An excel spreadsheet that contains all the data in tabular format
A GDB containing boundaries, modified boundaries (if applicable), the catchment polygons for each health facility and potential outreach site, all settlements and all settlements that are due for mobile sessions (i.e. not part of an outreach or fixed-post catchment).
Exports can be selected for one or several boundaries at once, and there is an option to have one separate file for each boundary or one file containing the information for all boundaries at once. Additionally, the PDF map can optionally contain one PDF per health facility catchment.
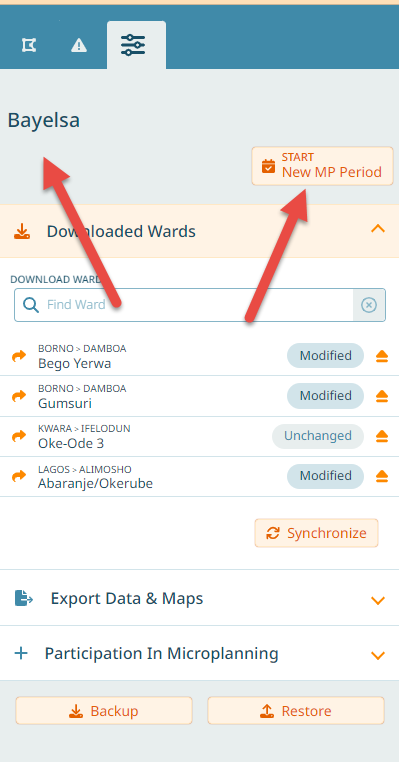
5.1.5. Resetting microplanning
Finally, once a round of microplanning has finished, the microplanning status on the dashboard needs to be reset. This is possible on State level. To do that, you need to go to the ‘Settings’ tab and click on ‘Start New MP Period’.
Note
This function is role based. A defined set of permissions is needed to reset microplanning for a State.