Tutorial 1
Purpose
The purpose of this first tutorial is to understand the most basic functionalities of the Geospatial Microplanning Toolkit (GMT). No previous knowledge of this application is required.
To achieve this, the following is introduced:
Access GMT
Login / Access to data
Obtain the data to do the microplanning
Review the health facility list, do minor modifications
Review the settlement list, do minor modifications
Review the microplan
Sync changes back to the database
Print the microplan
Note: “clicking” in this guide can be substituted by “tapping” as well - for instance if you are working on a tablet.
Let’s Get Started!
Access GMT
For training (to get familiar with the application), in a browser, ideally Google Chrome, navigate to
https://nga-training.gmt.health/
Note that this is the URL to do only the training.
For the field activity, the URL is
You should see the following:
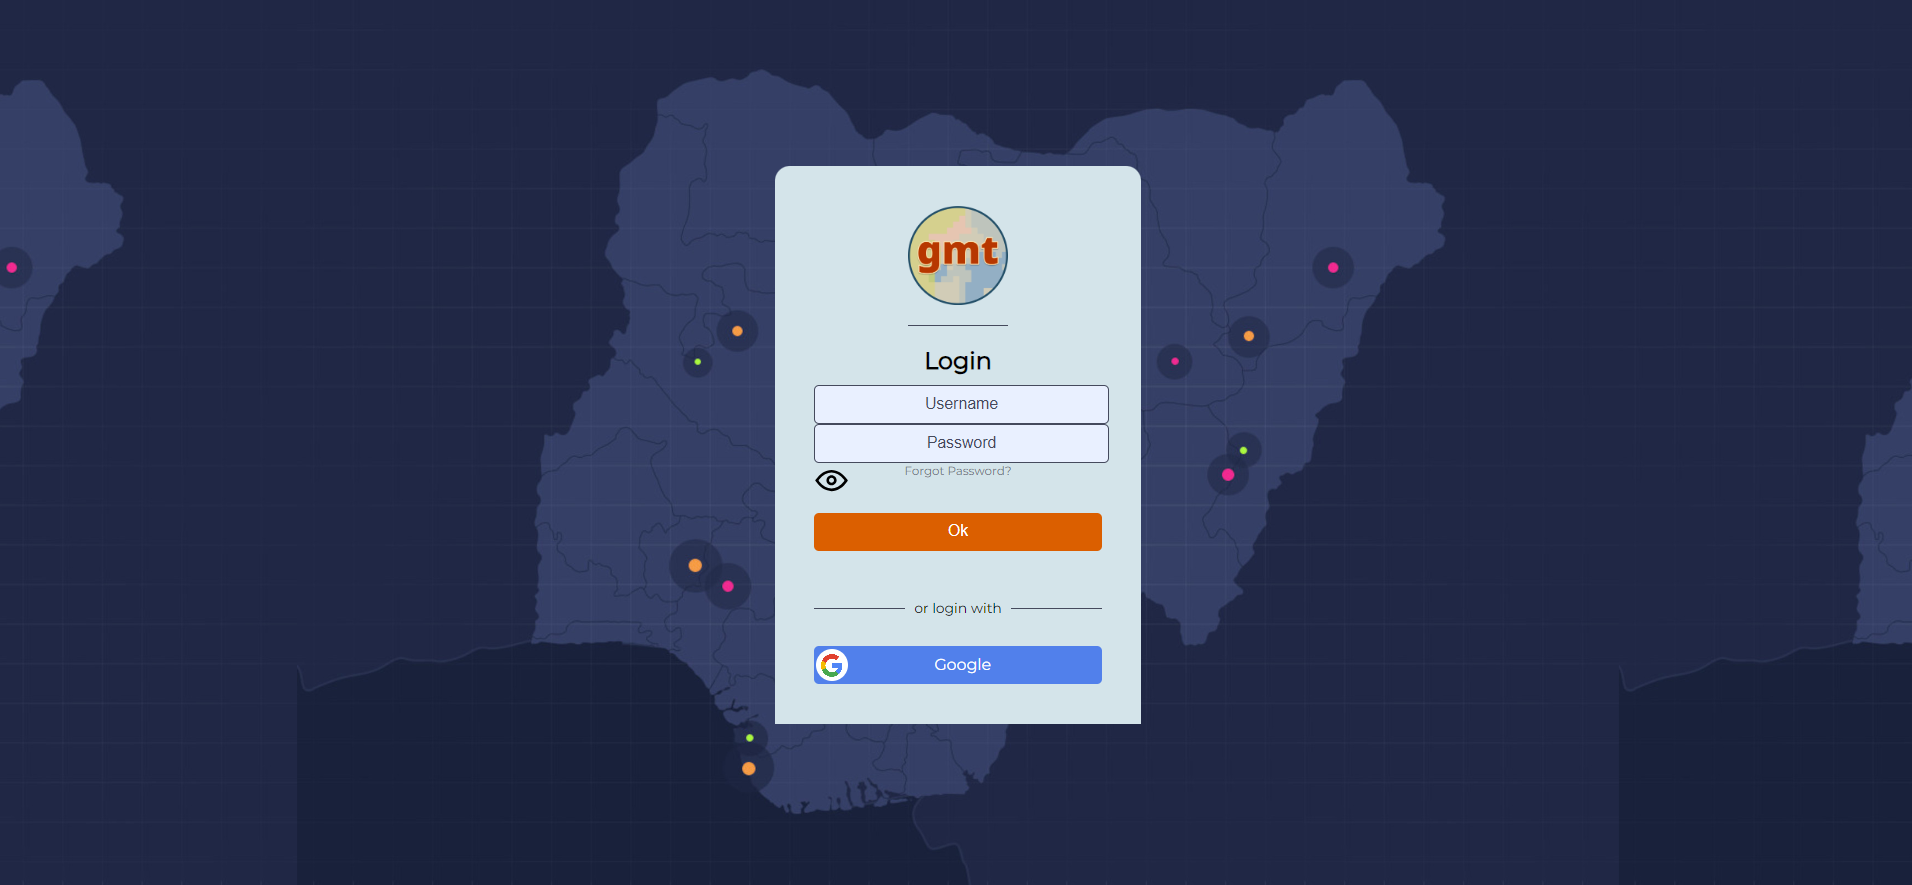
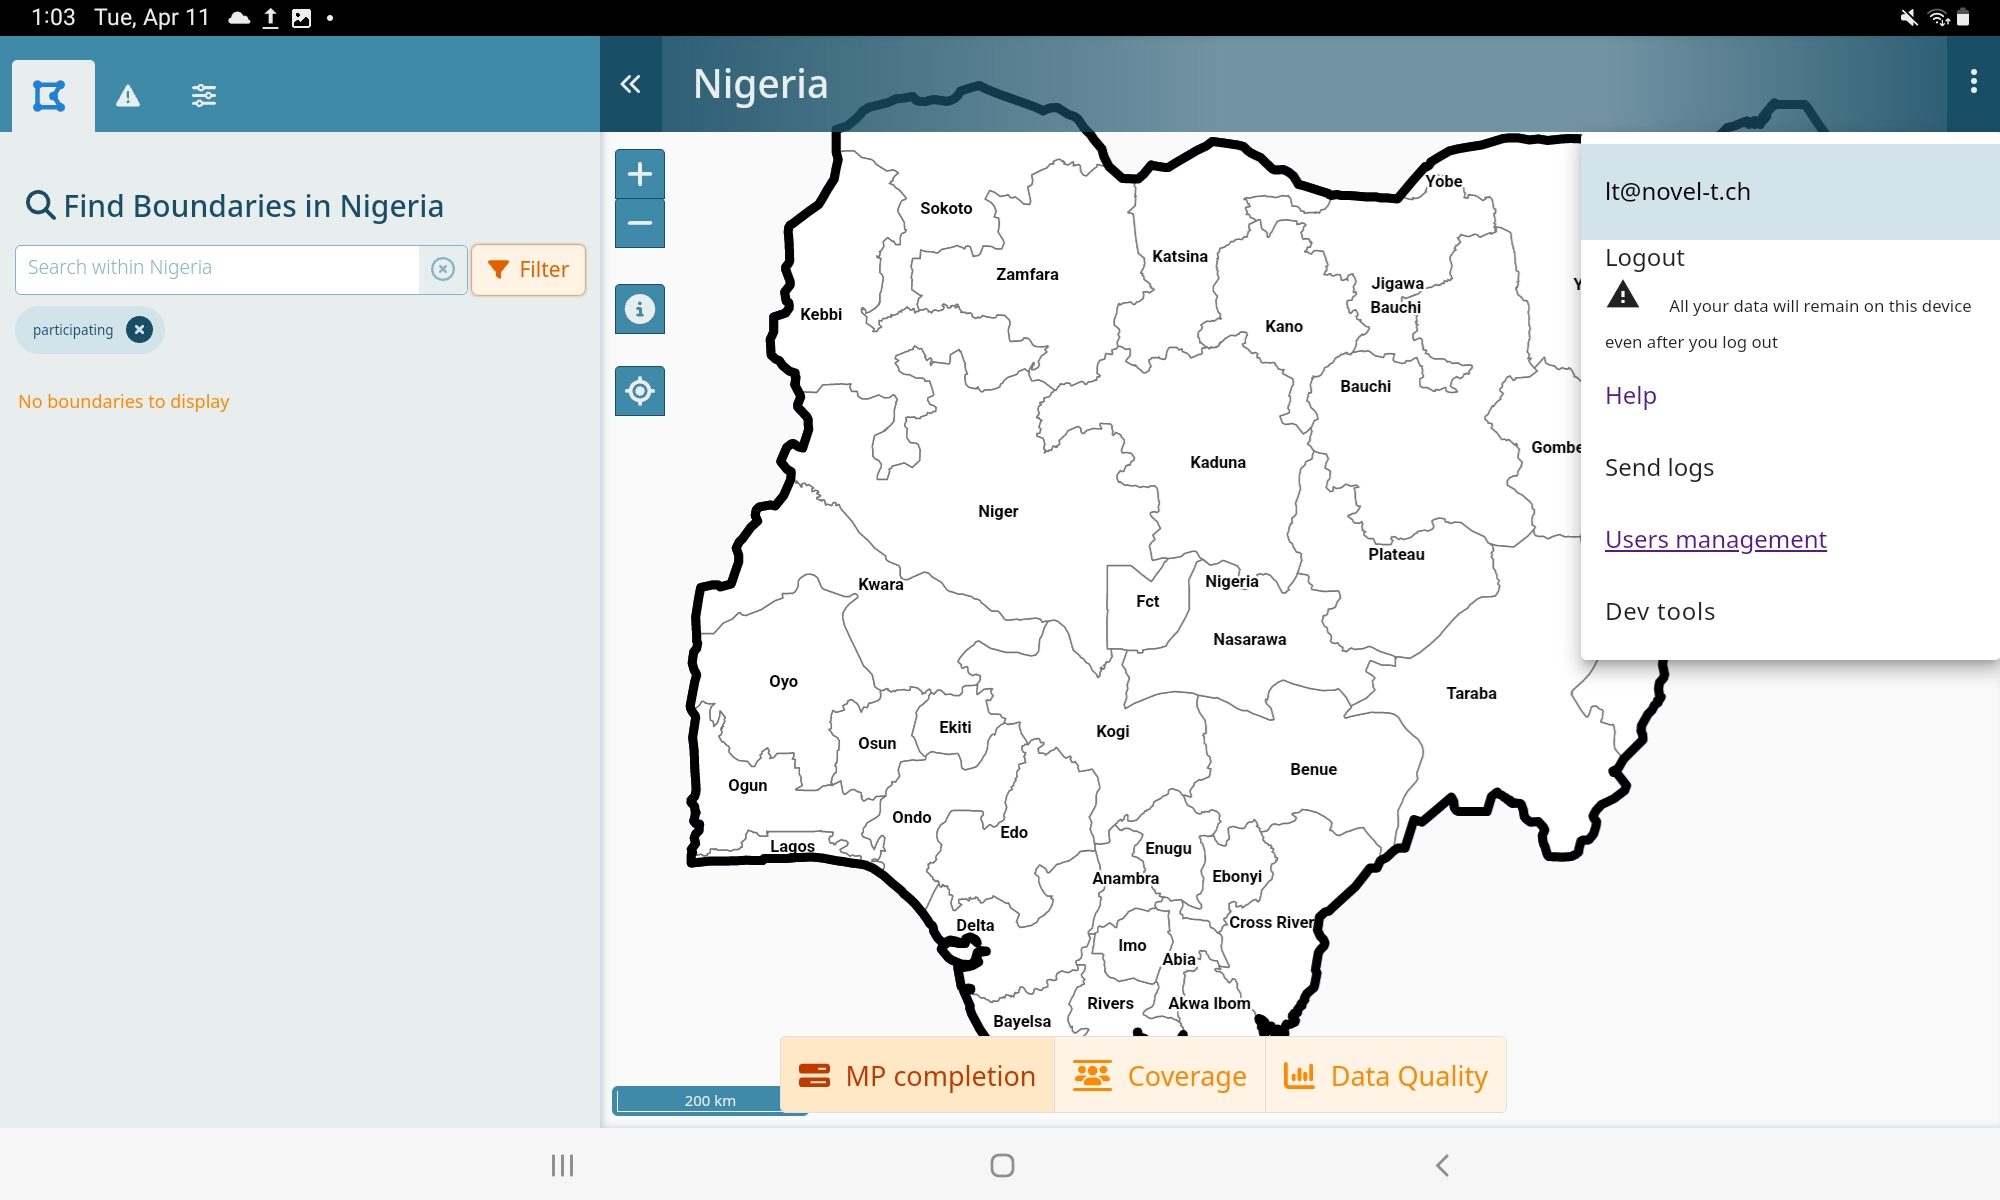
Login / Access to data
Provide your credentials here.
Note
For an enhanced user experience or if you are working on a tablet, you should be installing the application.
Follow the steps shown below to do so:
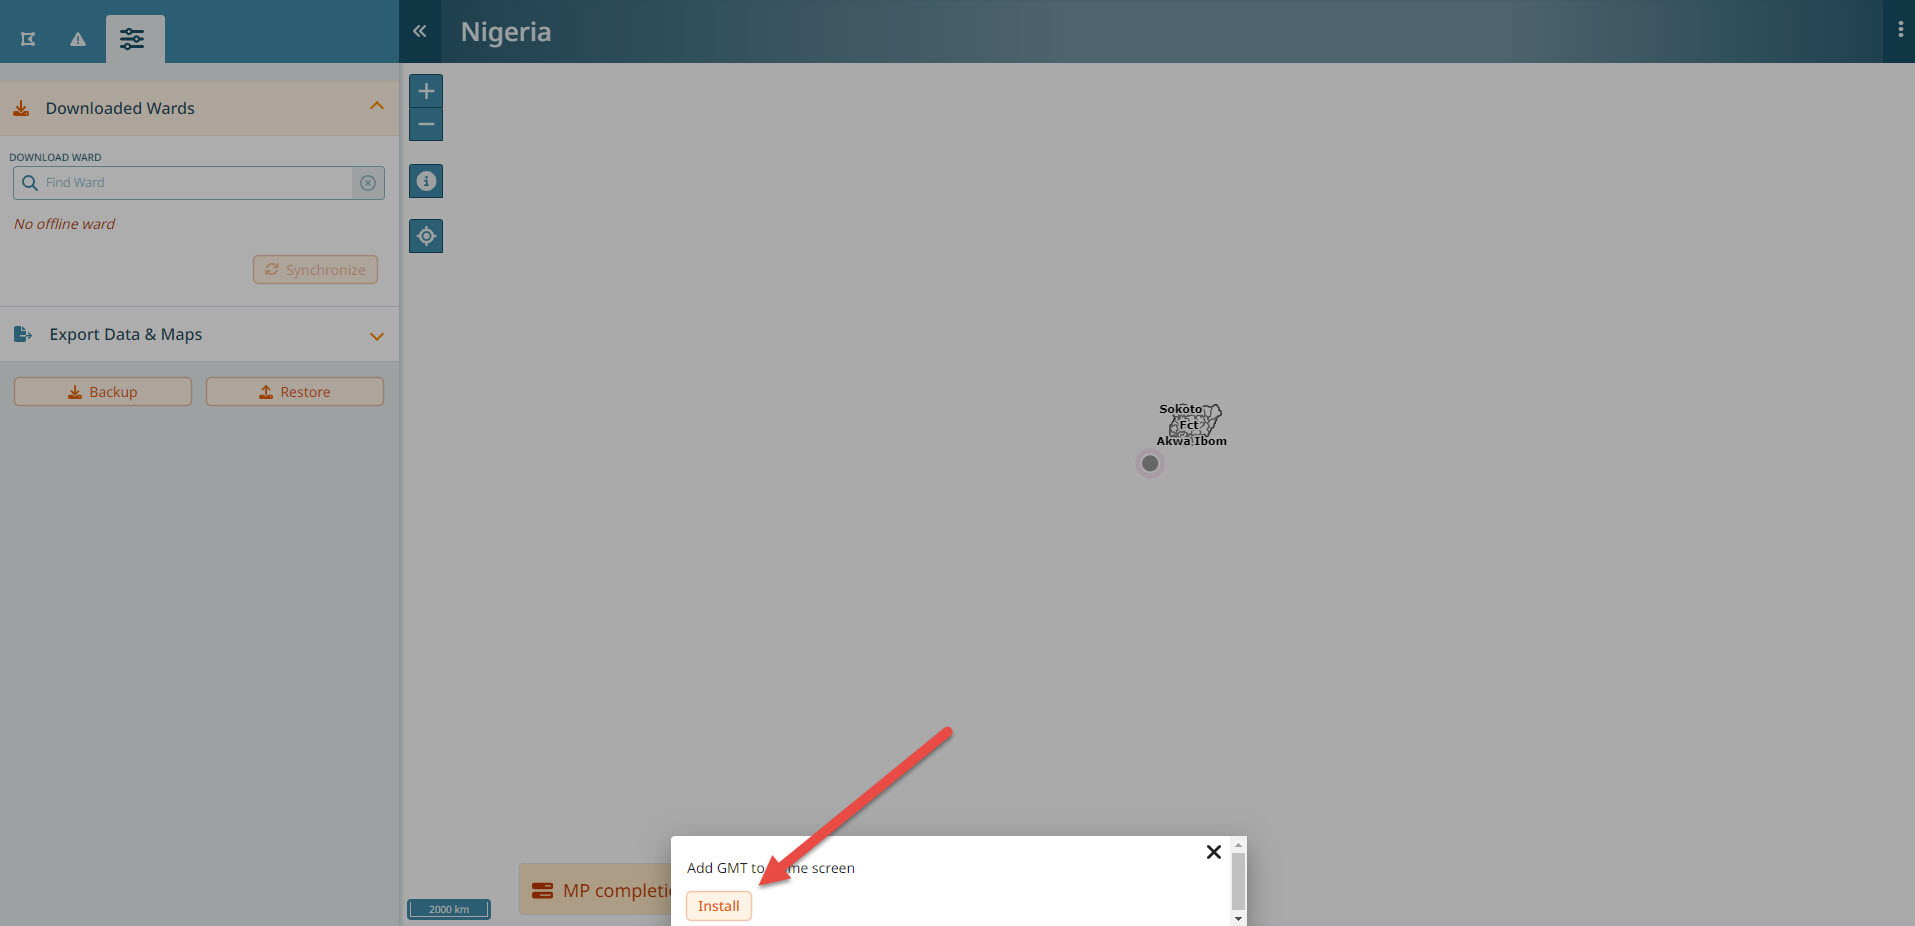
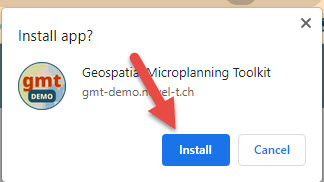
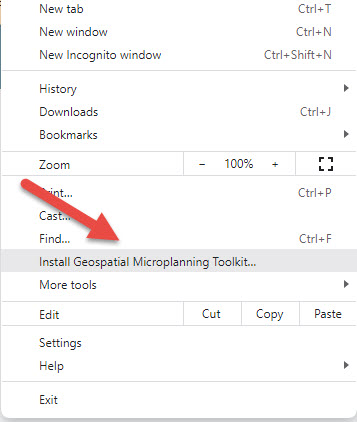
If you closed the dialog without clicking on install, you can alternatively use the 3-dot menu in Google Chrome. Click on it and select “Install App”.
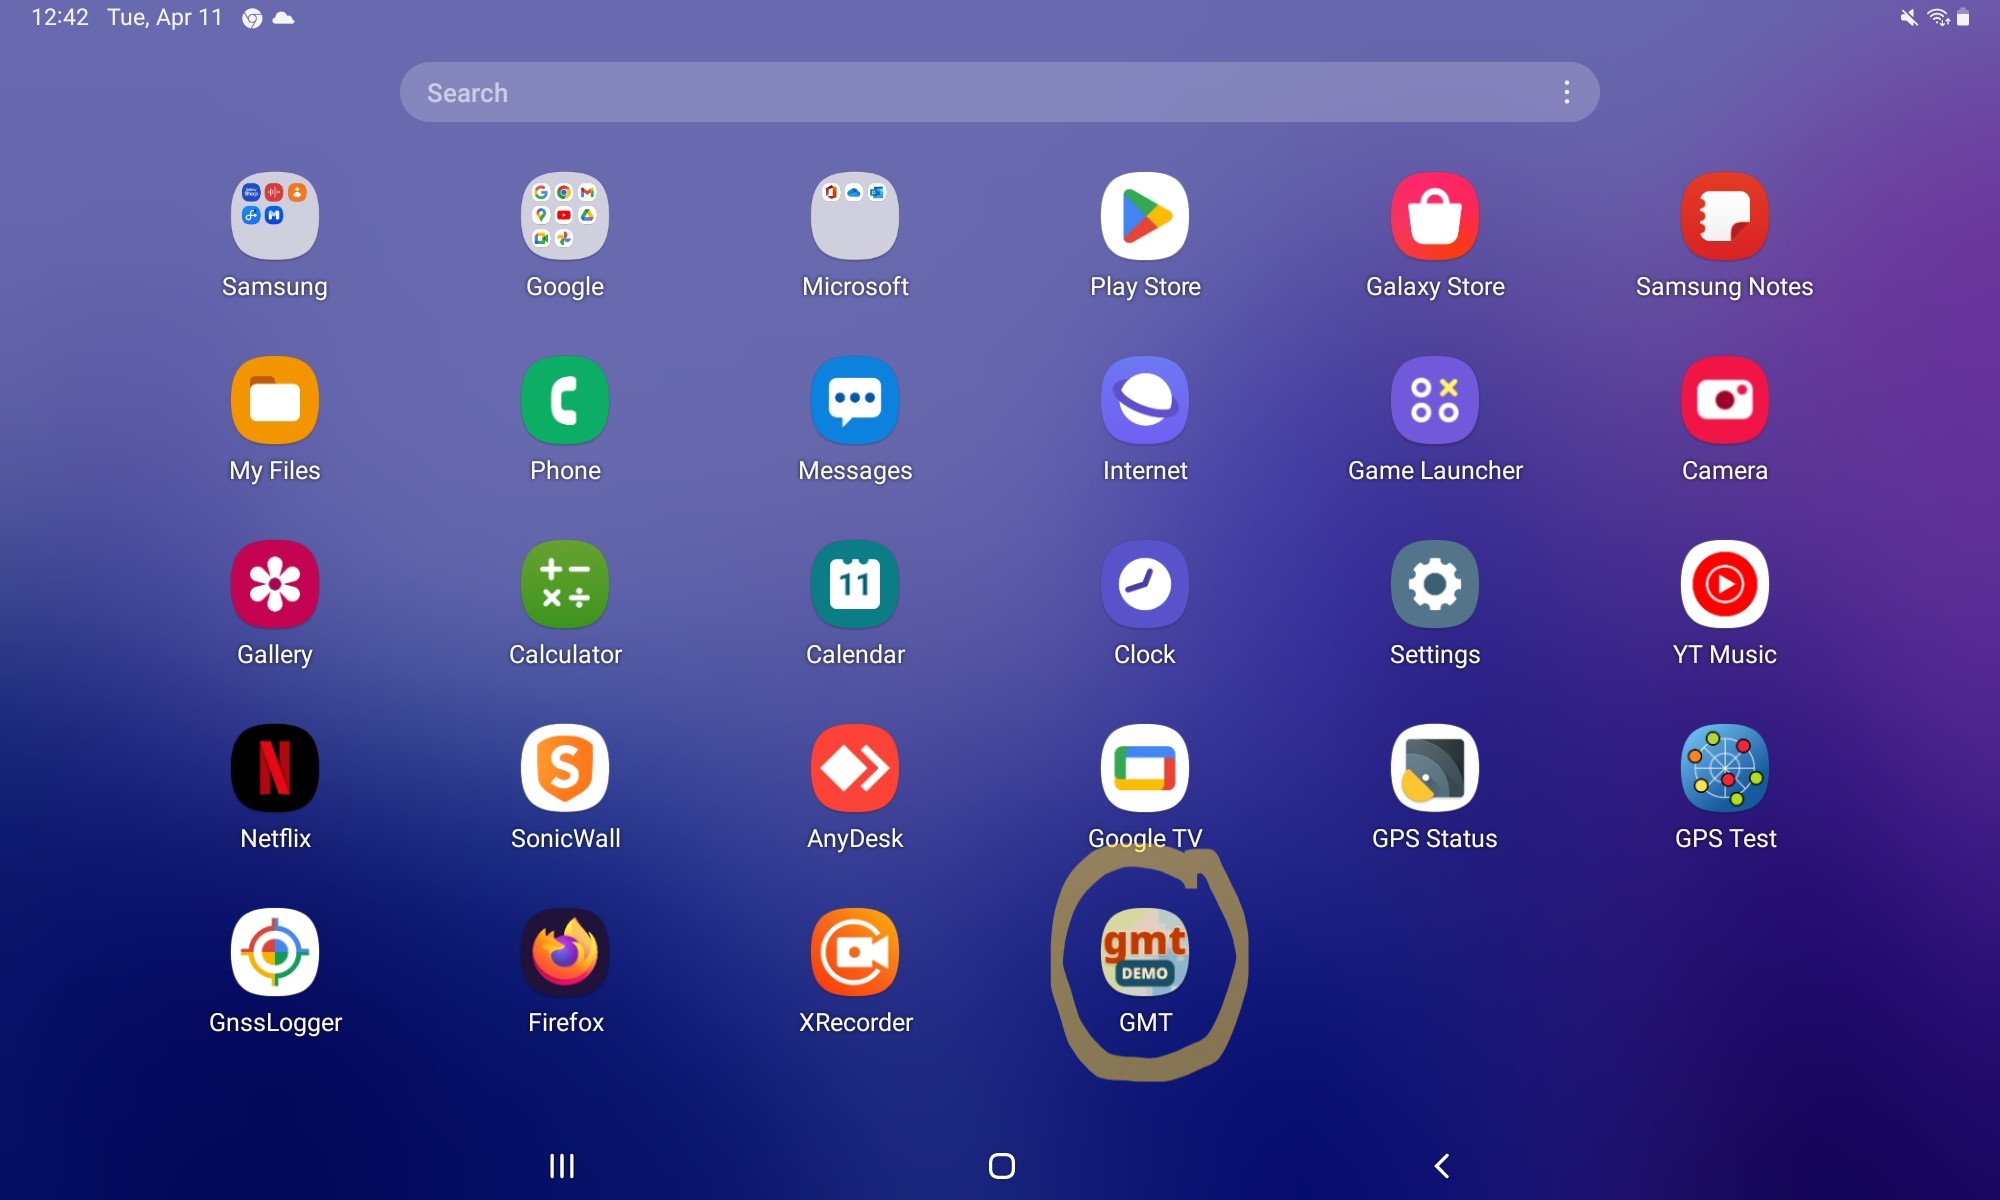
In either case, you should now see the app icon in your applications:
You can close Chrome and continue from the application. Make sure you have the right application installed. On a computer, this is the case if you can see a blue ribbon at the top of the app:
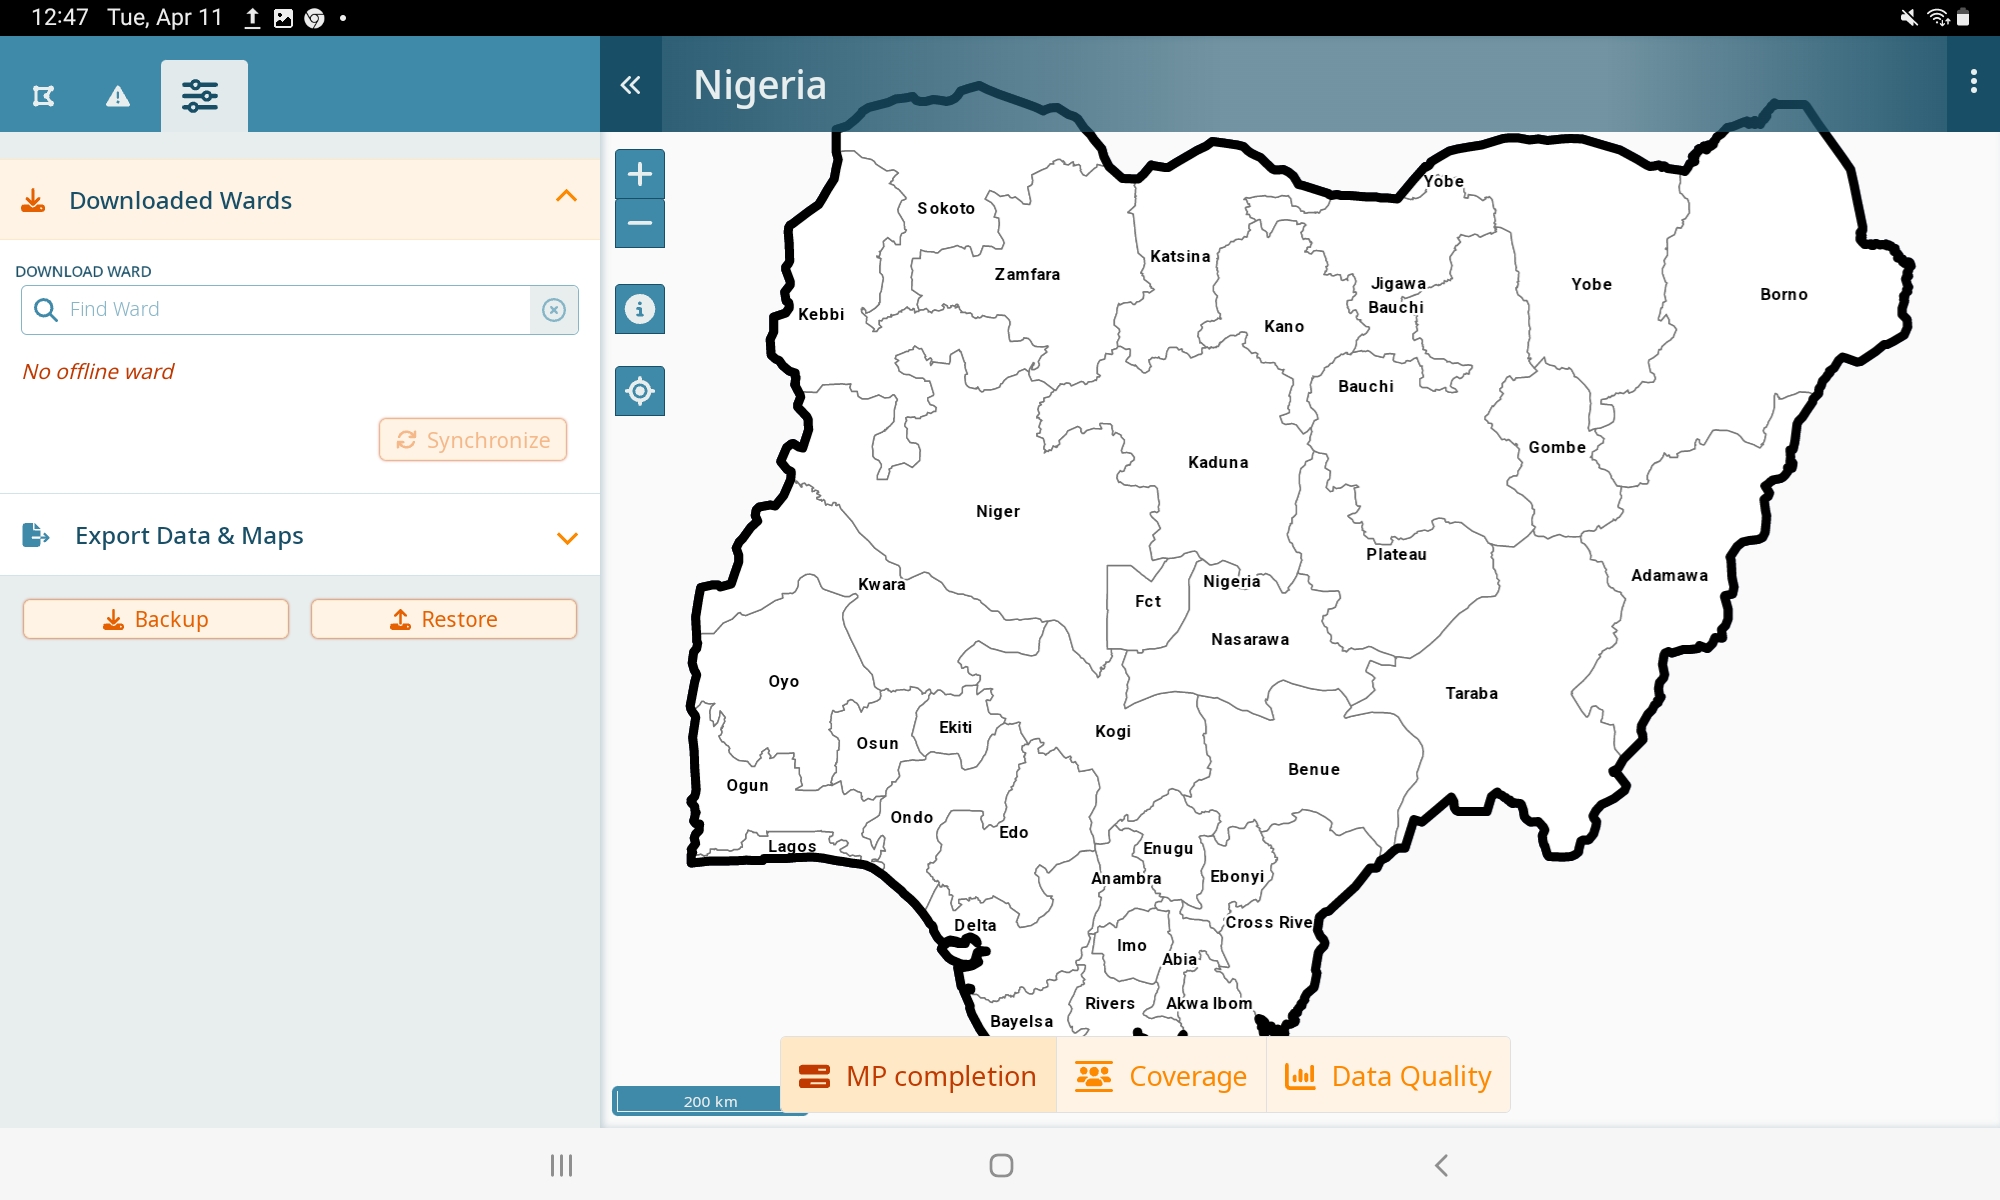
On a tablet, you should no longer see an input field at the top.
You should see this:
Not this!
In the app, click on the menu for the help:
You should be redirected to the help now and once you are offline, you will have access to this documentation as well.
Taking data offline
You can use the map to navigate by clicking on the areas of interest to you, alternatively use the ‘Downloaded wards’ section.
We will be assuming the role of a ward focal person in “Amuzi”, a ward located in LGA “Ahiazu-Mbaise” in the State “Imo”.
Let’s use the search: type “amuzi” in the search bar.
You should see:
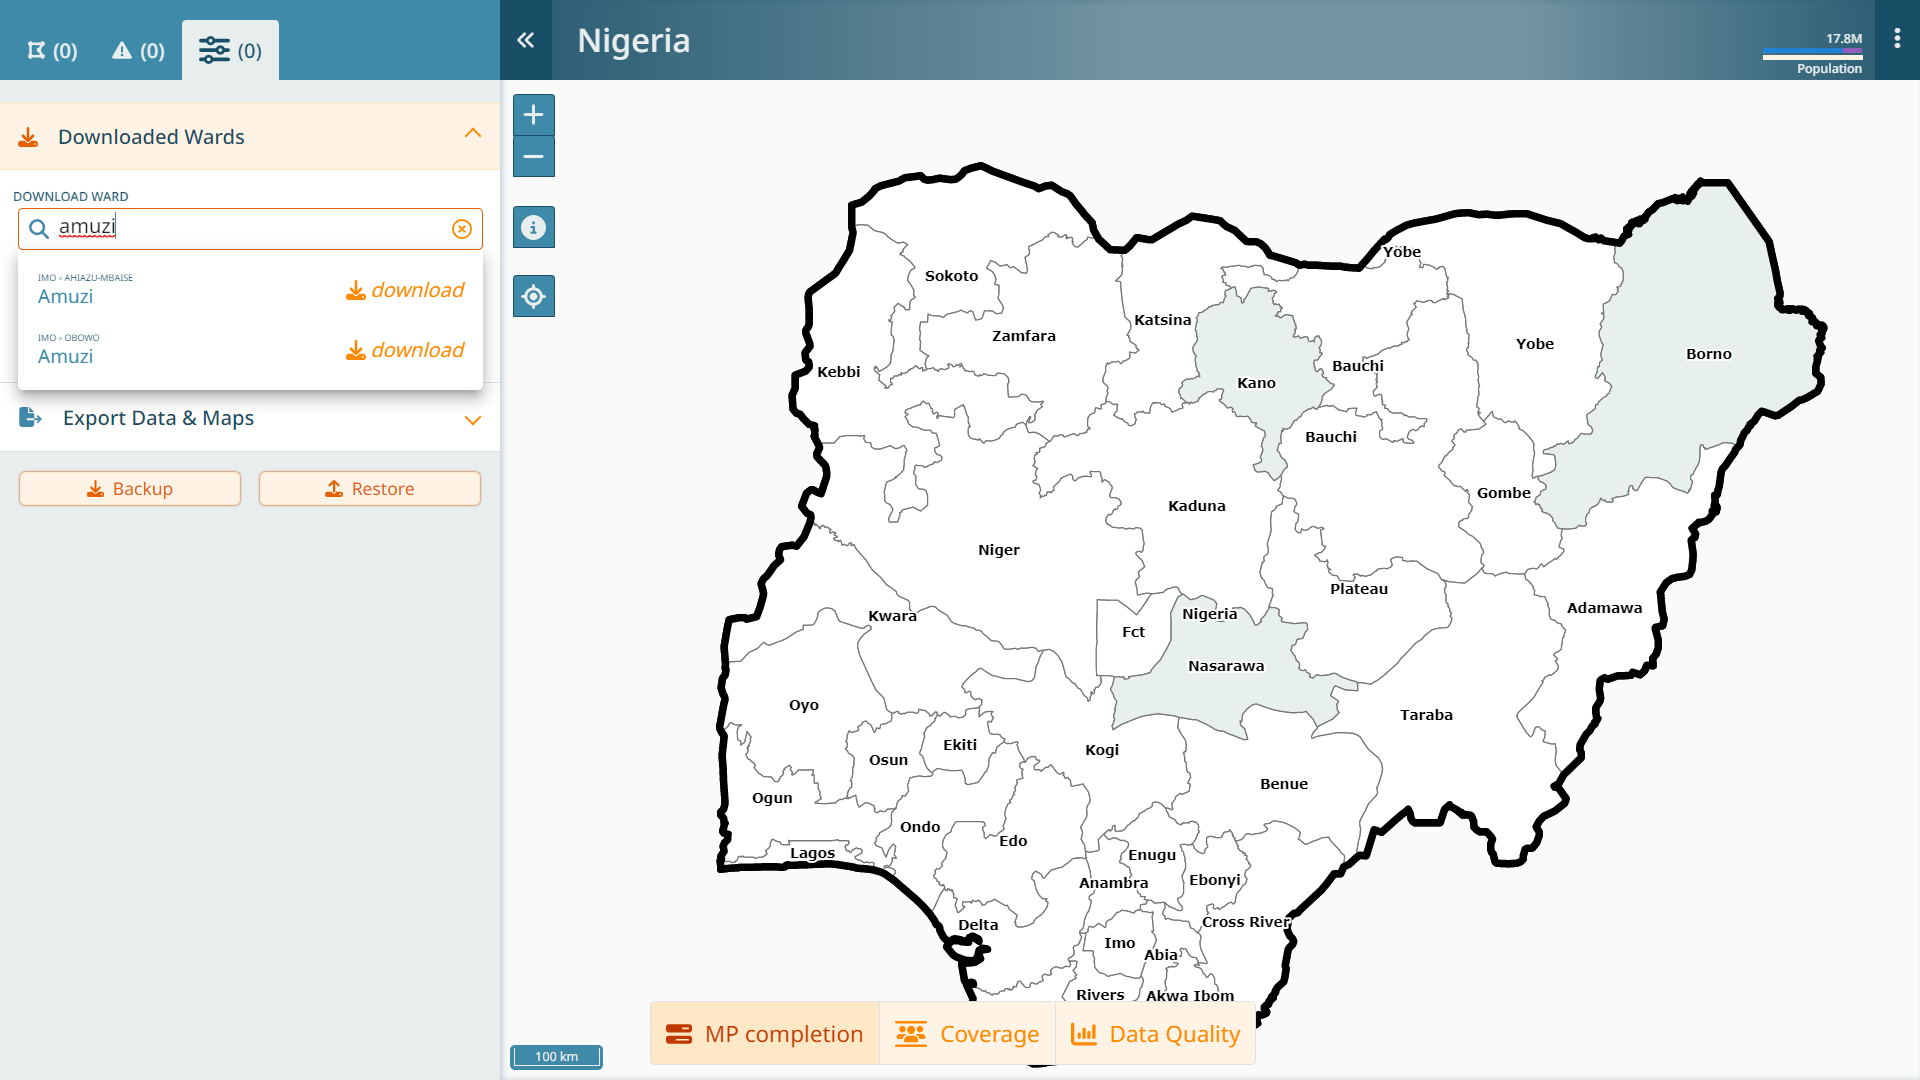
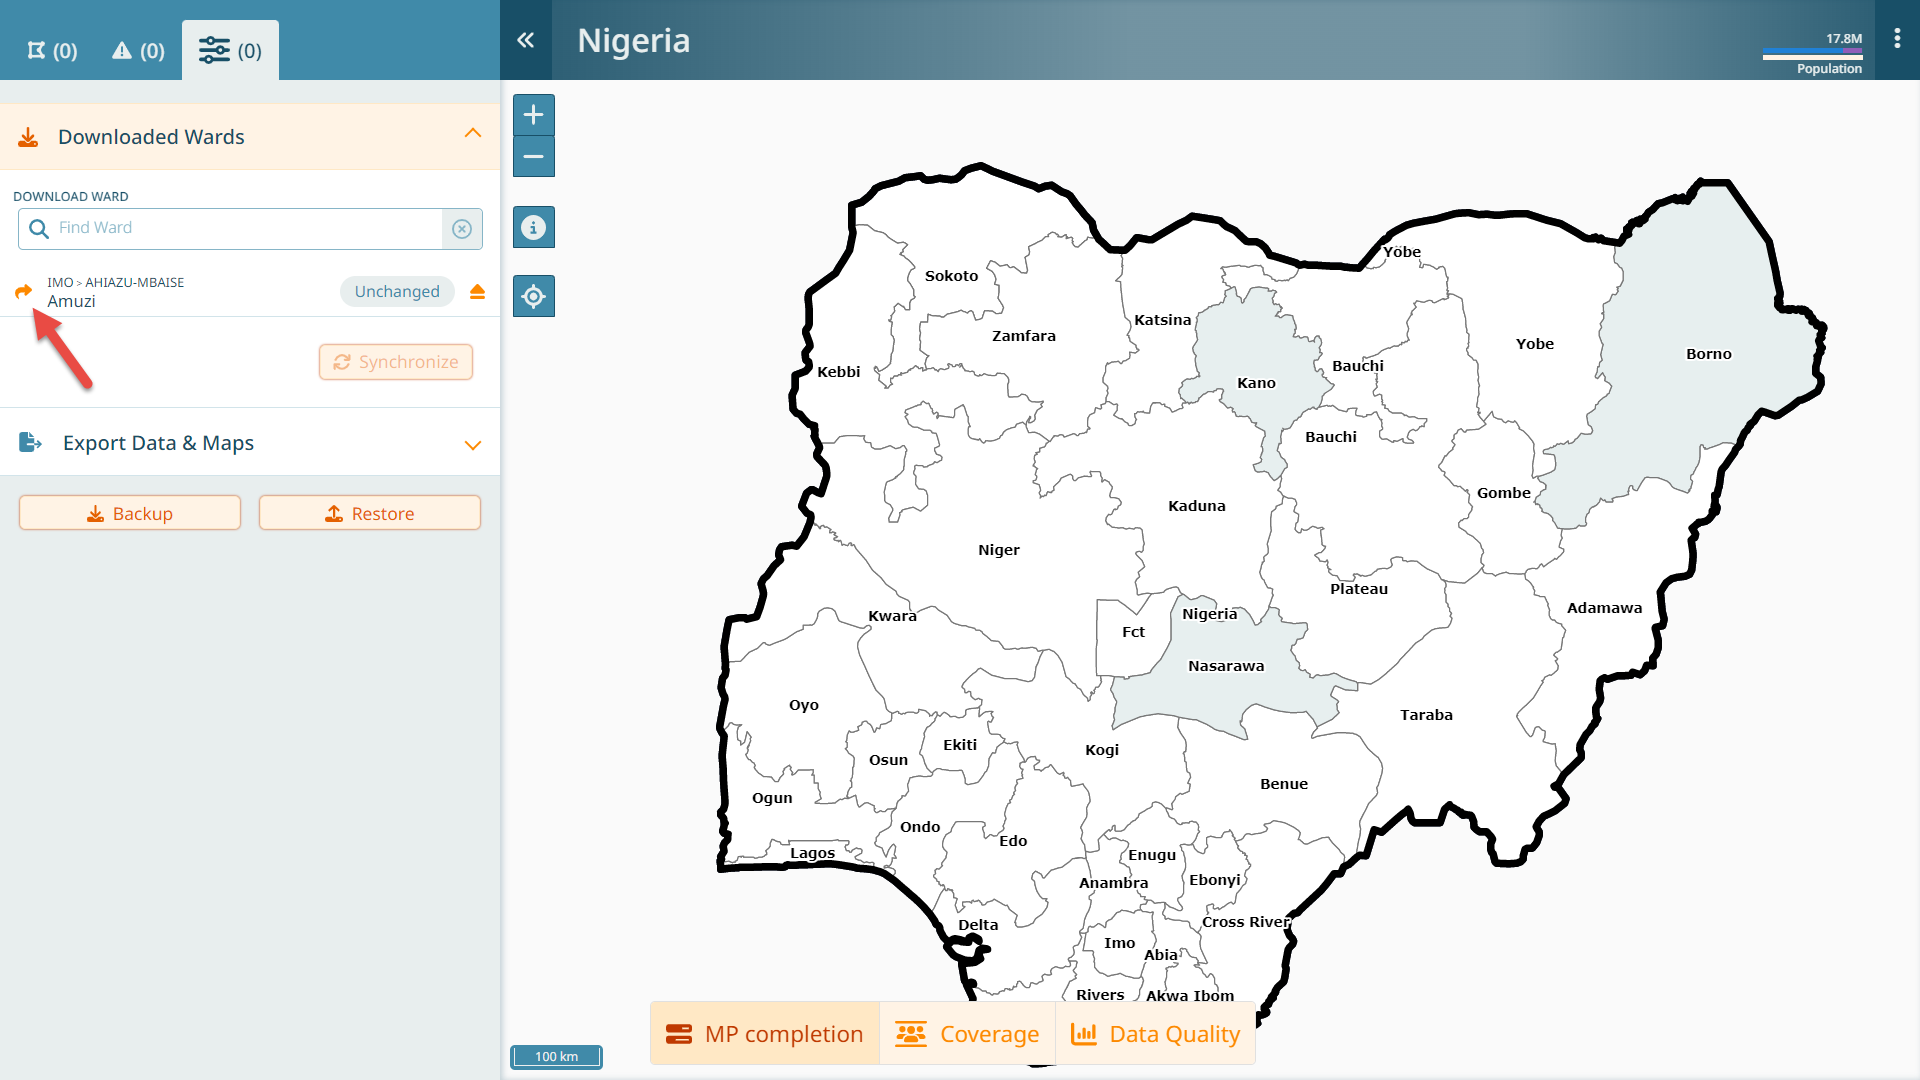
Microplanning in the field may happen where there is no connectivity. Thus, the application is designed to work offline. Accordingly, the data we want to edit needs to be downloaded. Click the “download” button. Once the data has been downloaded (this may take a while, depending on your connection speed - even with a fast connection, it can take over five minutes, depending on the ward size), you will see that ward available in the ‘Downloaded wards’ section.
Click now on the the arrow next to “Amuzi” to enter the microplanning screen.
General UI Overview
You will be guided through the interface step by step.
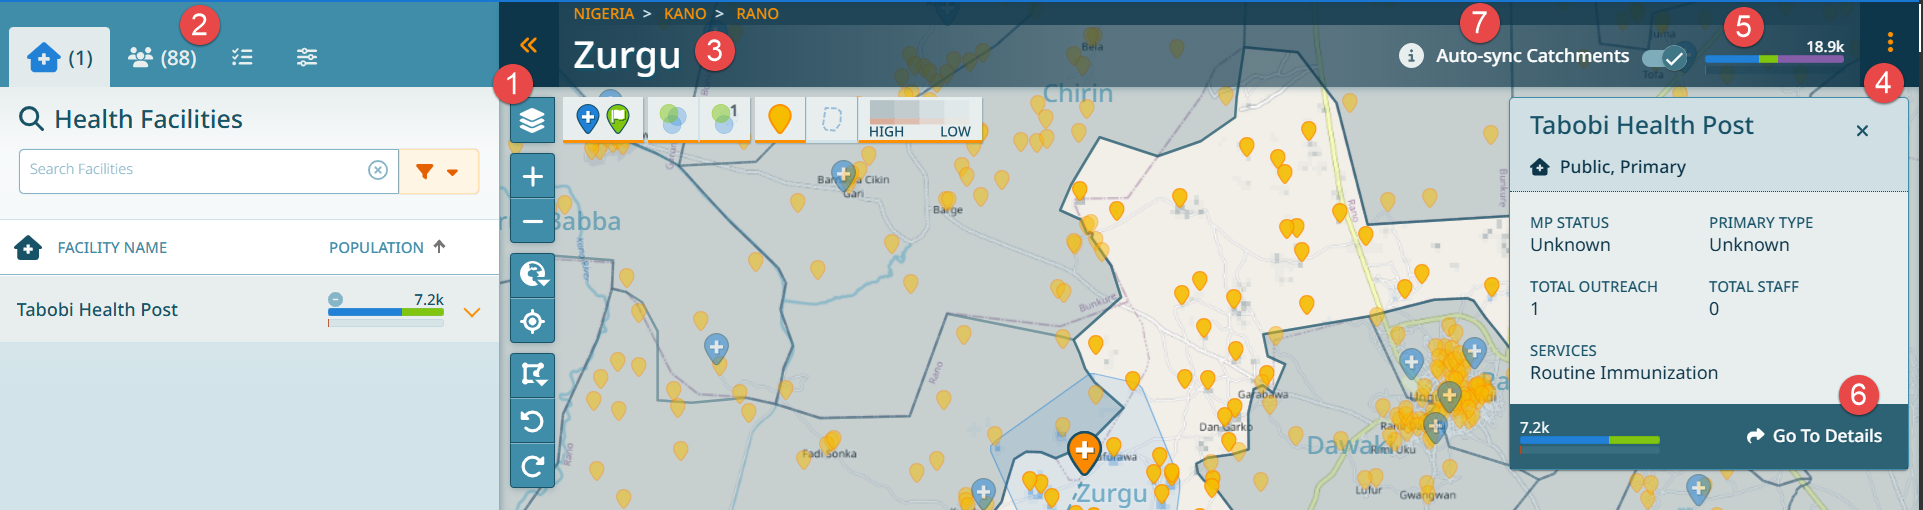
There are few key things on the interface that we introduce here:
The interface is divided into the map and a left side bar. The left side bar can always be collapsed.
The left sidebar has four tabs: the health facility tab, the settlement tab, the attention/ToDo tab and the manage tab.
The header shows which ward you are in and it allows you to navigate back to the dashboard, if needed.
The header has a 3-dotted menu, where your email address is shown as well as a link to the help, a logout and some technical buttons to send logs.
The header shows the population of the current ward along with a colored bar. We’ll cover the colors later.
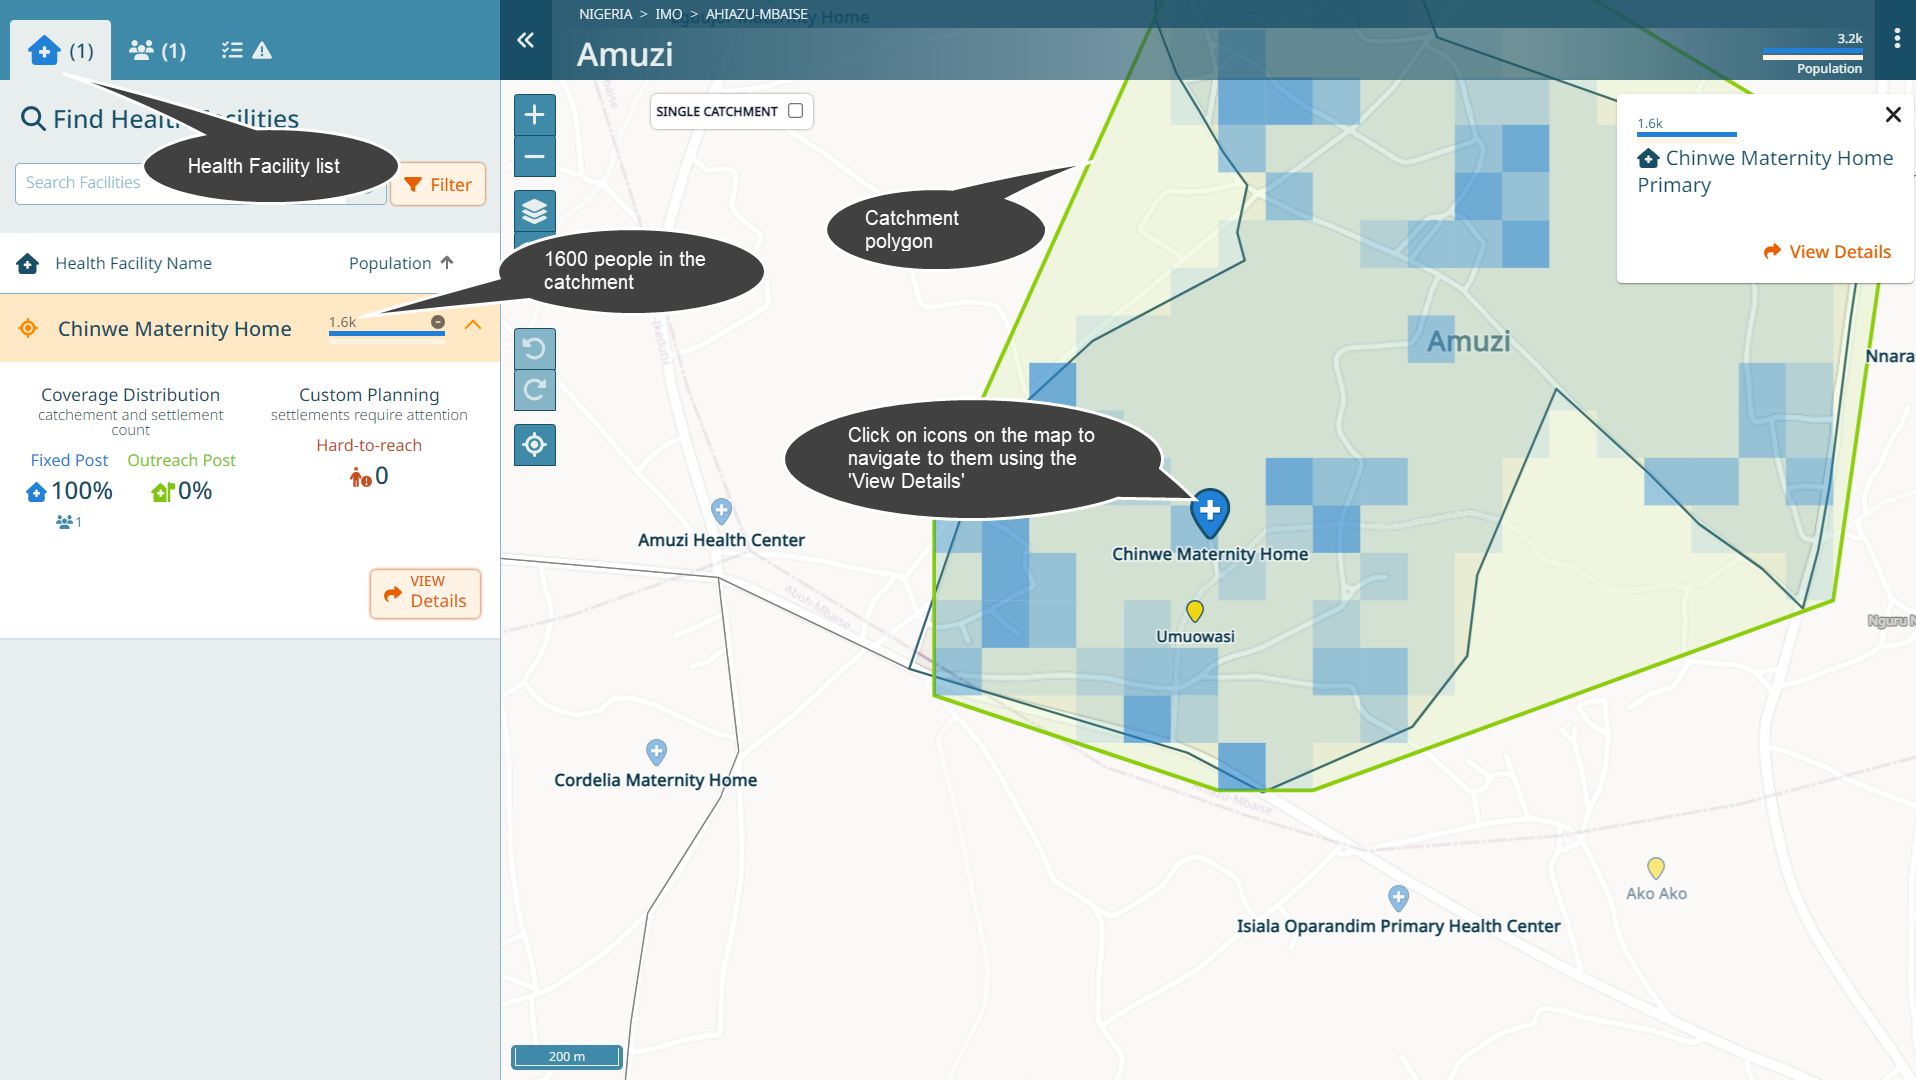
When clicking on an icon on the map, a popup allows to you navigate to the details of this item on the left side bar.
The header shows if auto-sync of catchments is toggled on or off. We’ll cover that later.
Review the Health Facility list
In the first step you should review the health facility list.
Hint
Our goal is to identify all health facilities in the current ward that we need to consider for microplanning. We also need to make sure they are at the right place and they have the right name and correct metadata.
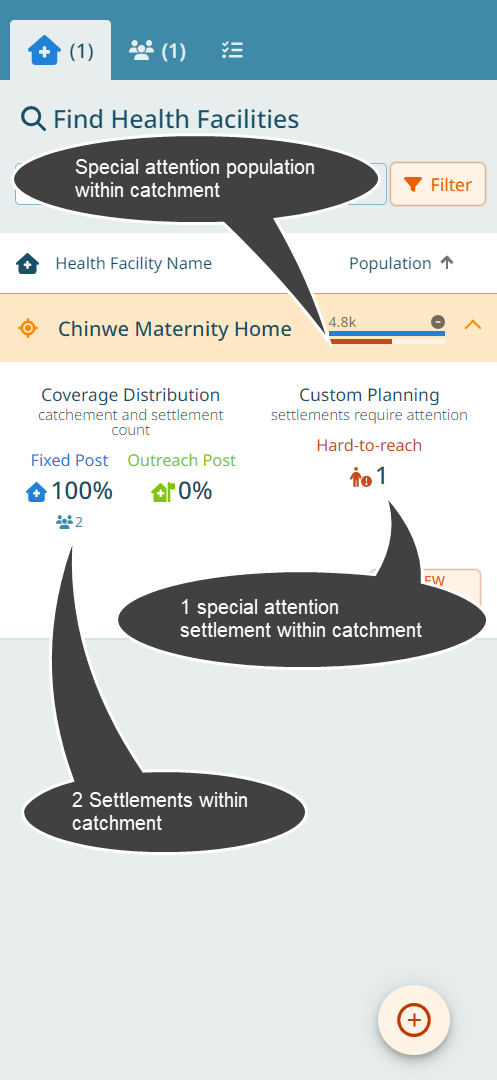
In this ward, there is one health facility as shown in the health facility list.
Important
For each health facility that provides routine immunization services, it is assumed that everyone within 2 kilometers of it is part of its catchment. Catchments can be refined to some extent, as we will see.
Click on the name.
Note
Note the following:
You can always click on symbols on the map and then navigate to the details of an icon you click via the popup ‘View Details’
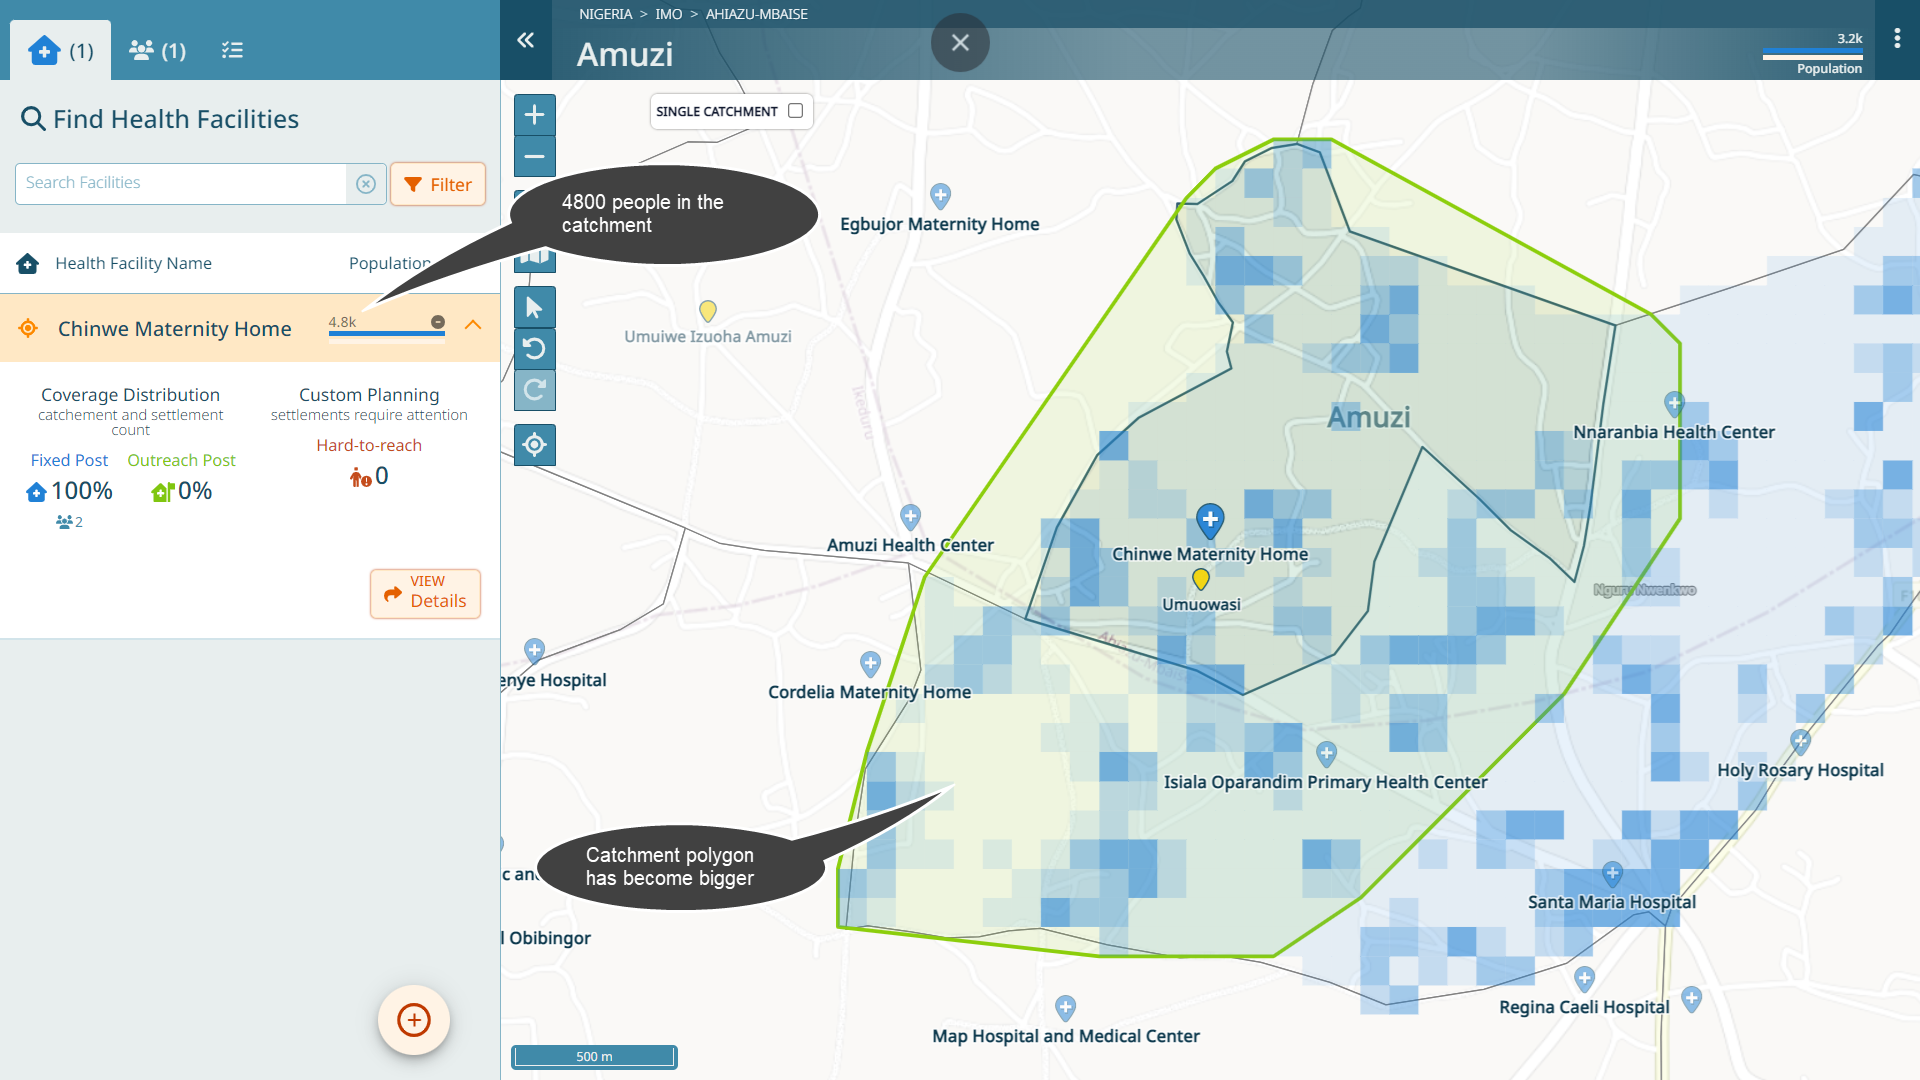
The catchment population for ‘Chinwe Maternity Home’ is currently estimated at 1600 people. This number corresponds to the sum of all population within two kilometers around the health facility. The catchment is visualized as a polygon on the map. The population is calculated using a population model. The colored squares correspond to population - the more dense a square, the more population is estimated within that square.
This health facility has only a fixed post catchment and no outreaches (we will get back to that later)
There are no settlements in its catchment that require special attention (we will get back to that later)
Click on ‘View Details’, either from the map or the list.
You should see this:
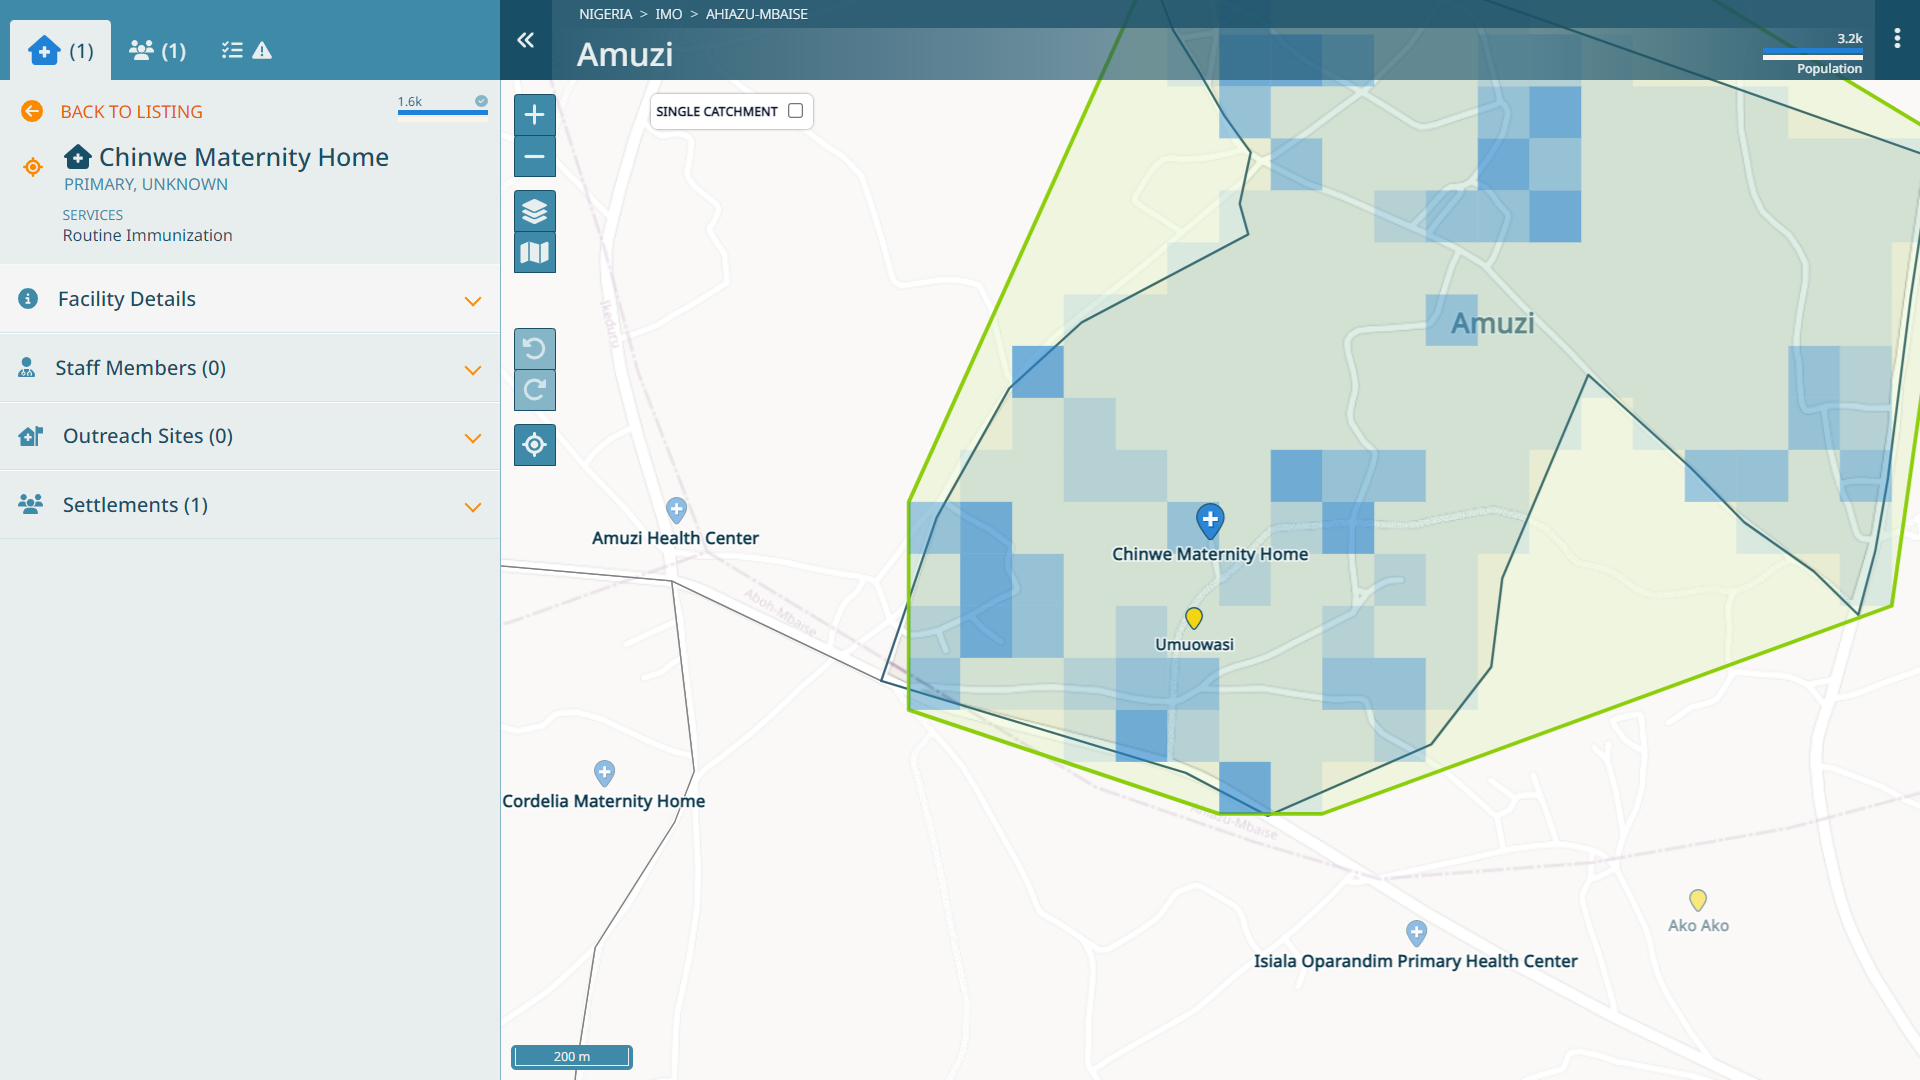
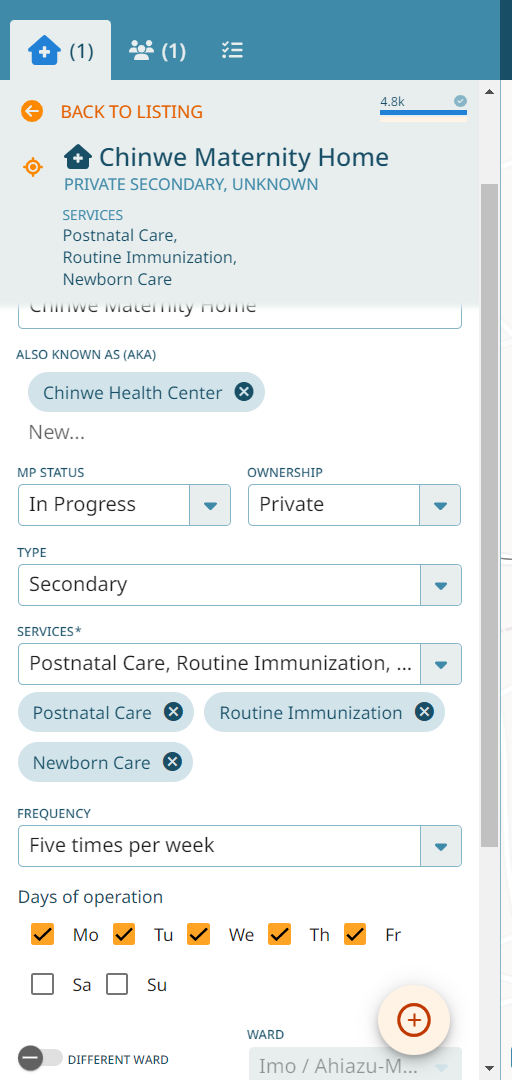
Let’s assume this health facility has the following attributes:
Some people refer to it as ‘Chinwe Health Center’
It is a private facility of secondary type
It provides routine immunization, postnatal and newborn care
It provides routine immunization services daily, except on week-ends
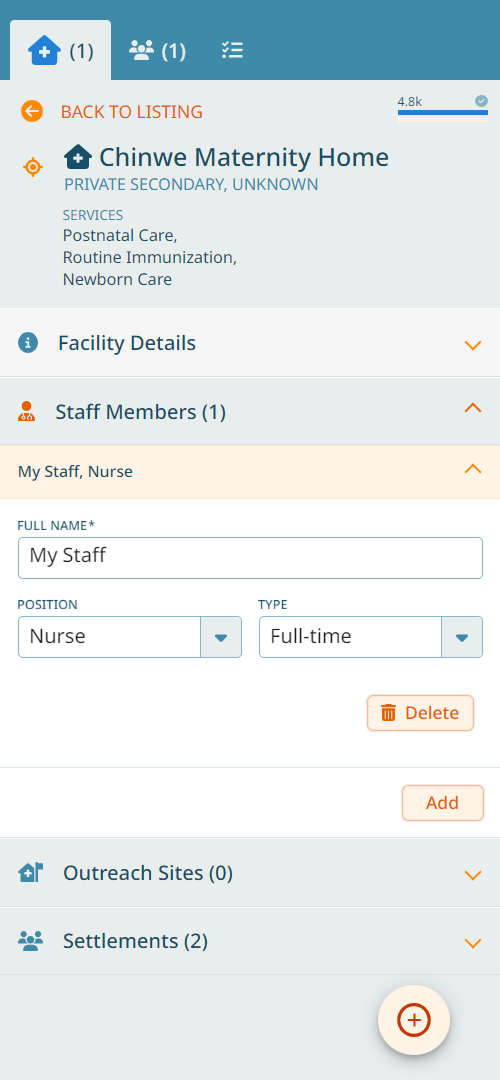
It has one full time staff
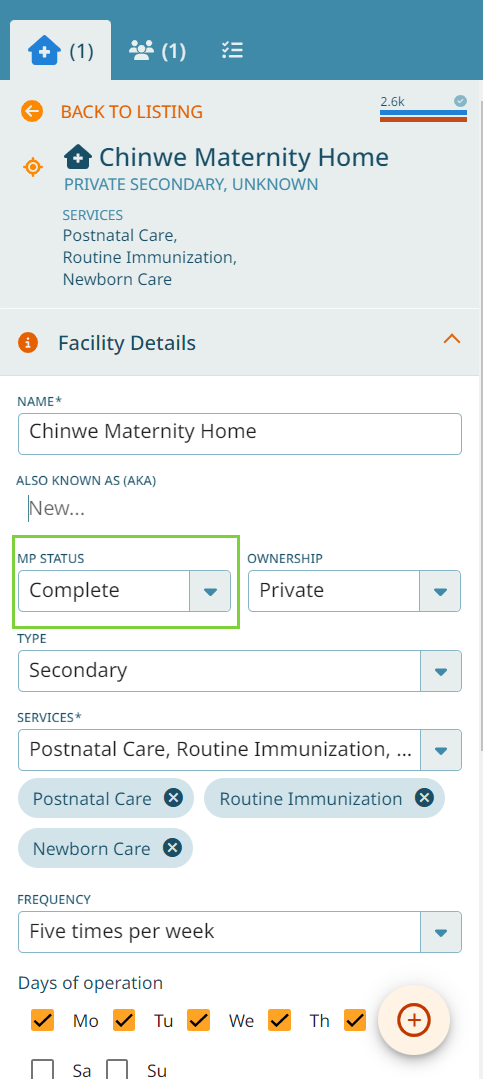
As we are now in the process of reviewing this health facility, we should set the status of microplanning to ‘In Progress’. Let’s modify this accordingly.
Note
A few things have changed:
The catchment polygon has become larger (compare to the above image)
The catchment population for this health facility has become bigger (compare to the 1600 people initially set)
As a result of this health facility having a larger catchment now, the polygon stretches into the neighboring ward
This is because we have defined the frequency for routine immunization services as daily. When surrounding facilities will do the microplanning at the same time, they might have higher or lower service frequency, which will impact how many people will visit their facility.
Click on ‘Back to listing’ on the top left.
At this point, let’s imagine that the health facility list is complete.
Important
When modifying any health facility data, catchments are updated. Depending on the changes, this can take a significant amount of time. In order to not have to wait for these catchment updates, you can deactivate the auto-sync catchments toggle in the header. Doing this, will no longer update the cathments, unless you press the refresh button next to it. Note the exclamation mark next to the population bar, which is also indicative that the current status may not be up to date.

Hint
We reached our first goal: all health facilities we need to consider for this ward are on the list and the metadata has been added.
Review the Settlement list
What are we referring to when we say “settlement”? It is a place that health workers refer to where they are planning routine immunization activities.
Hint
Next, our goal is to identify all settlements in the current ward that we need to consider for microplanning. We need to make sure they are at the right place and that they have the right name.
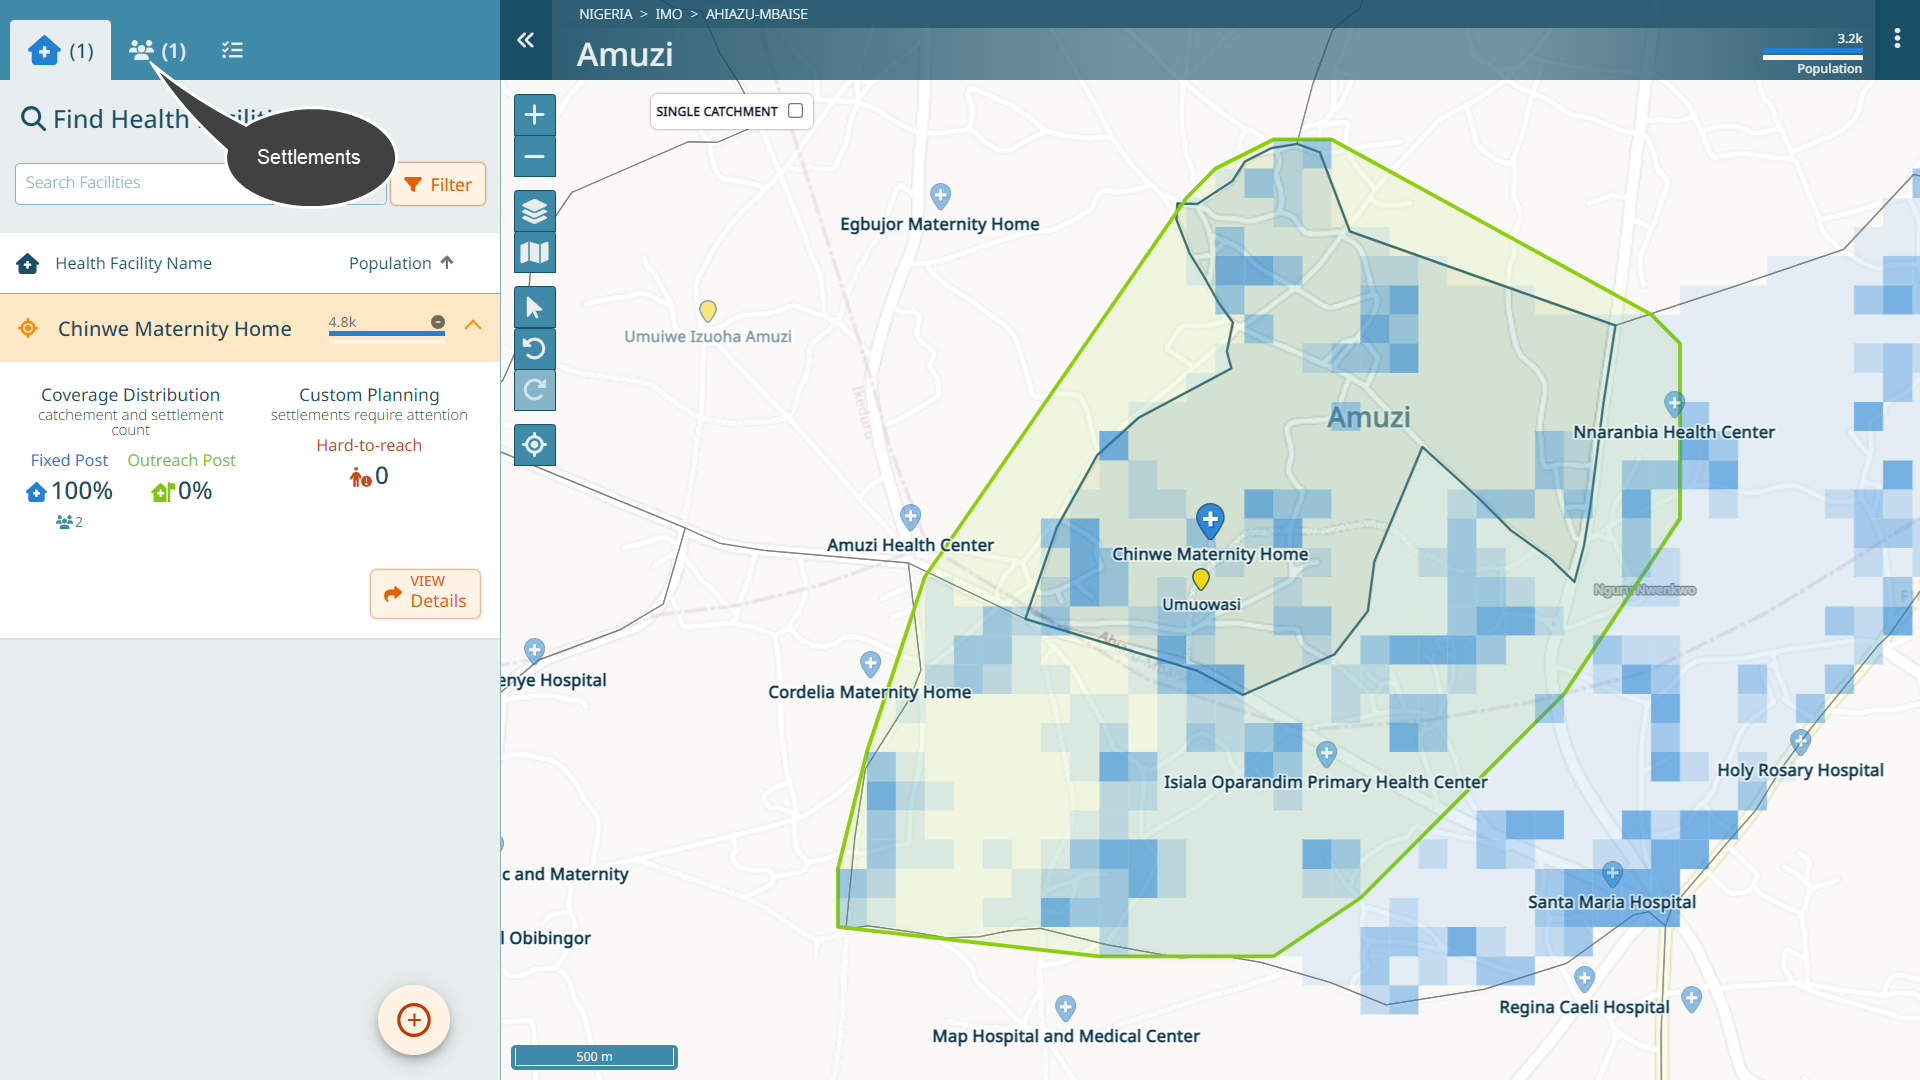
To do this, we will look at the settlement list. Click on the “Settlements” button.
Note
There are similarities to the health facility list:
You can click on any settlement icon on the map or the list to view the details
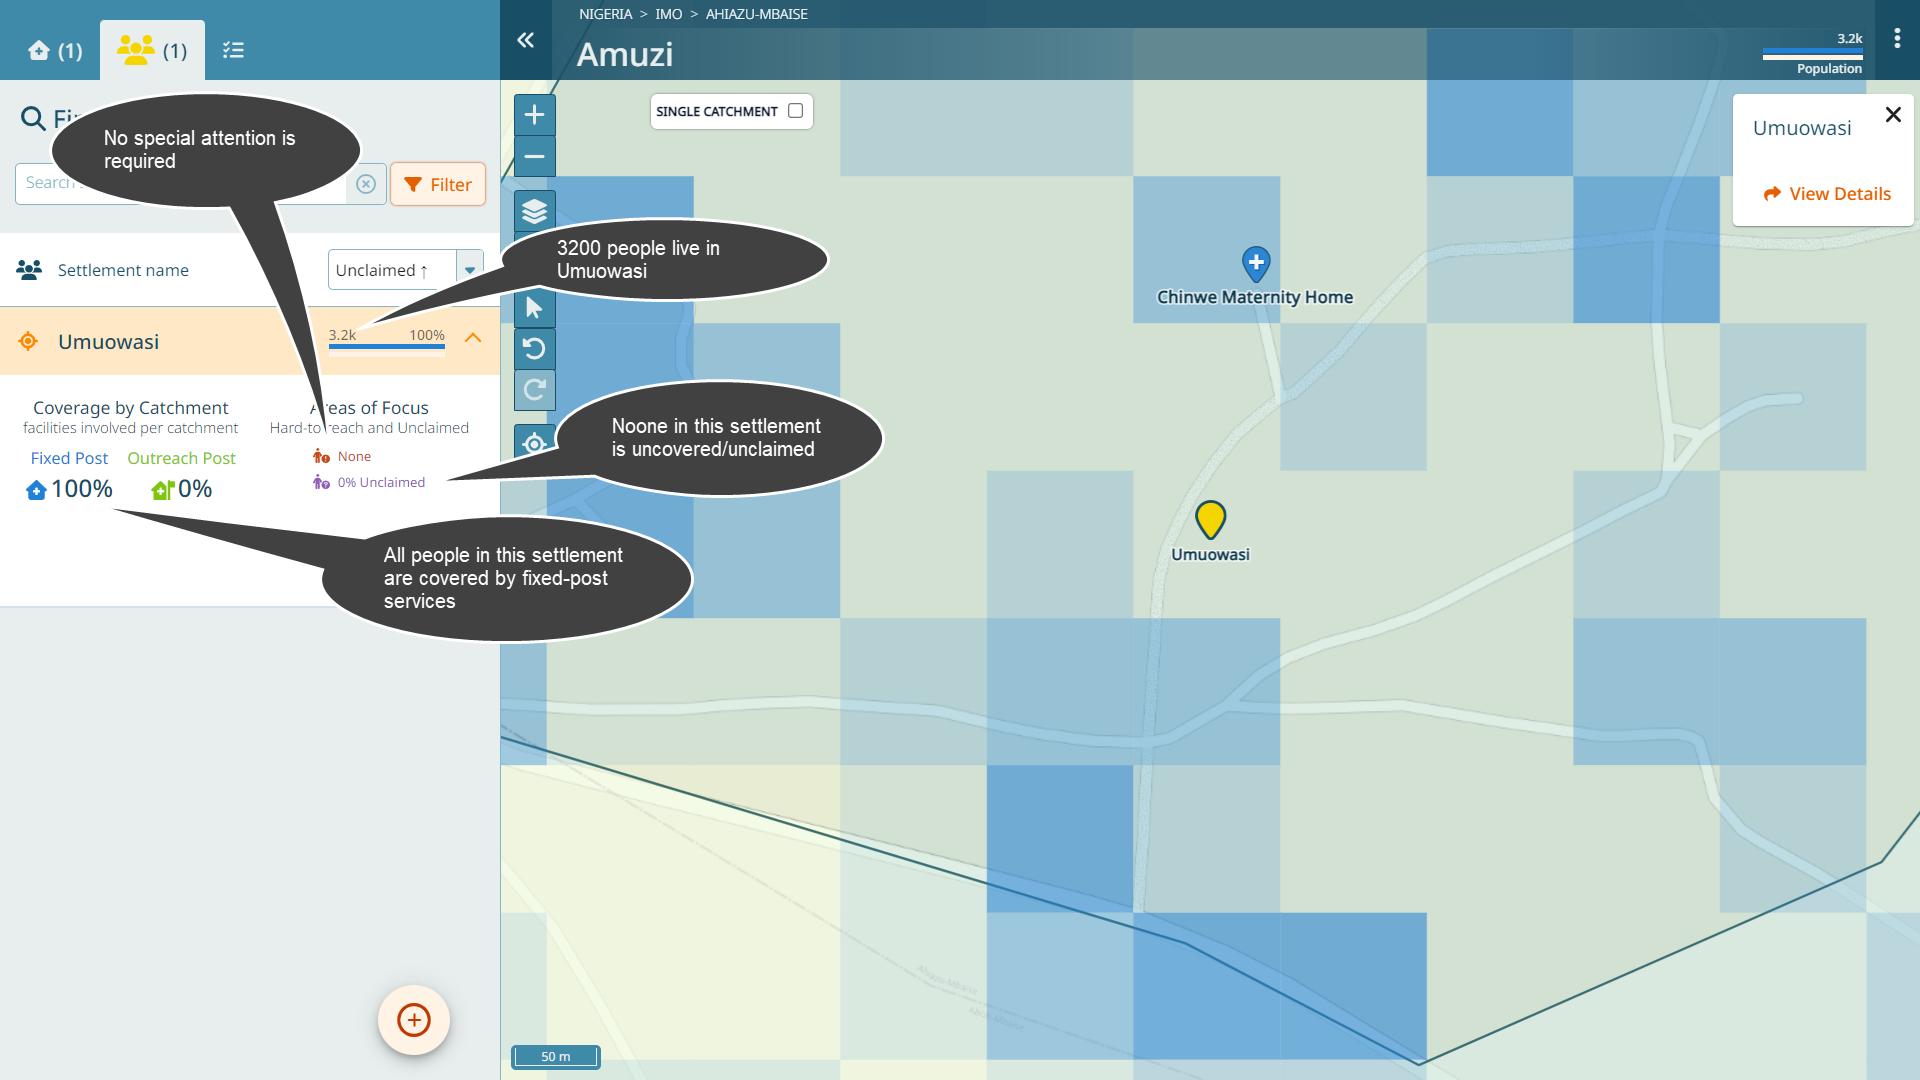
Each settlement has a calculated population value, coming from a population model. We can add a field estimate to a settlement, as we will see shortly.
When you click on the settlement name in the list, you see that it is covered 100% by a fixed post service
There is no population that requires special attention (we will come back later to this)
Click on ‘View Details’ from either the map or the list for Umuowasi.
Settlement details
You should see this:

Let’s assume this settlement has the following attributes:
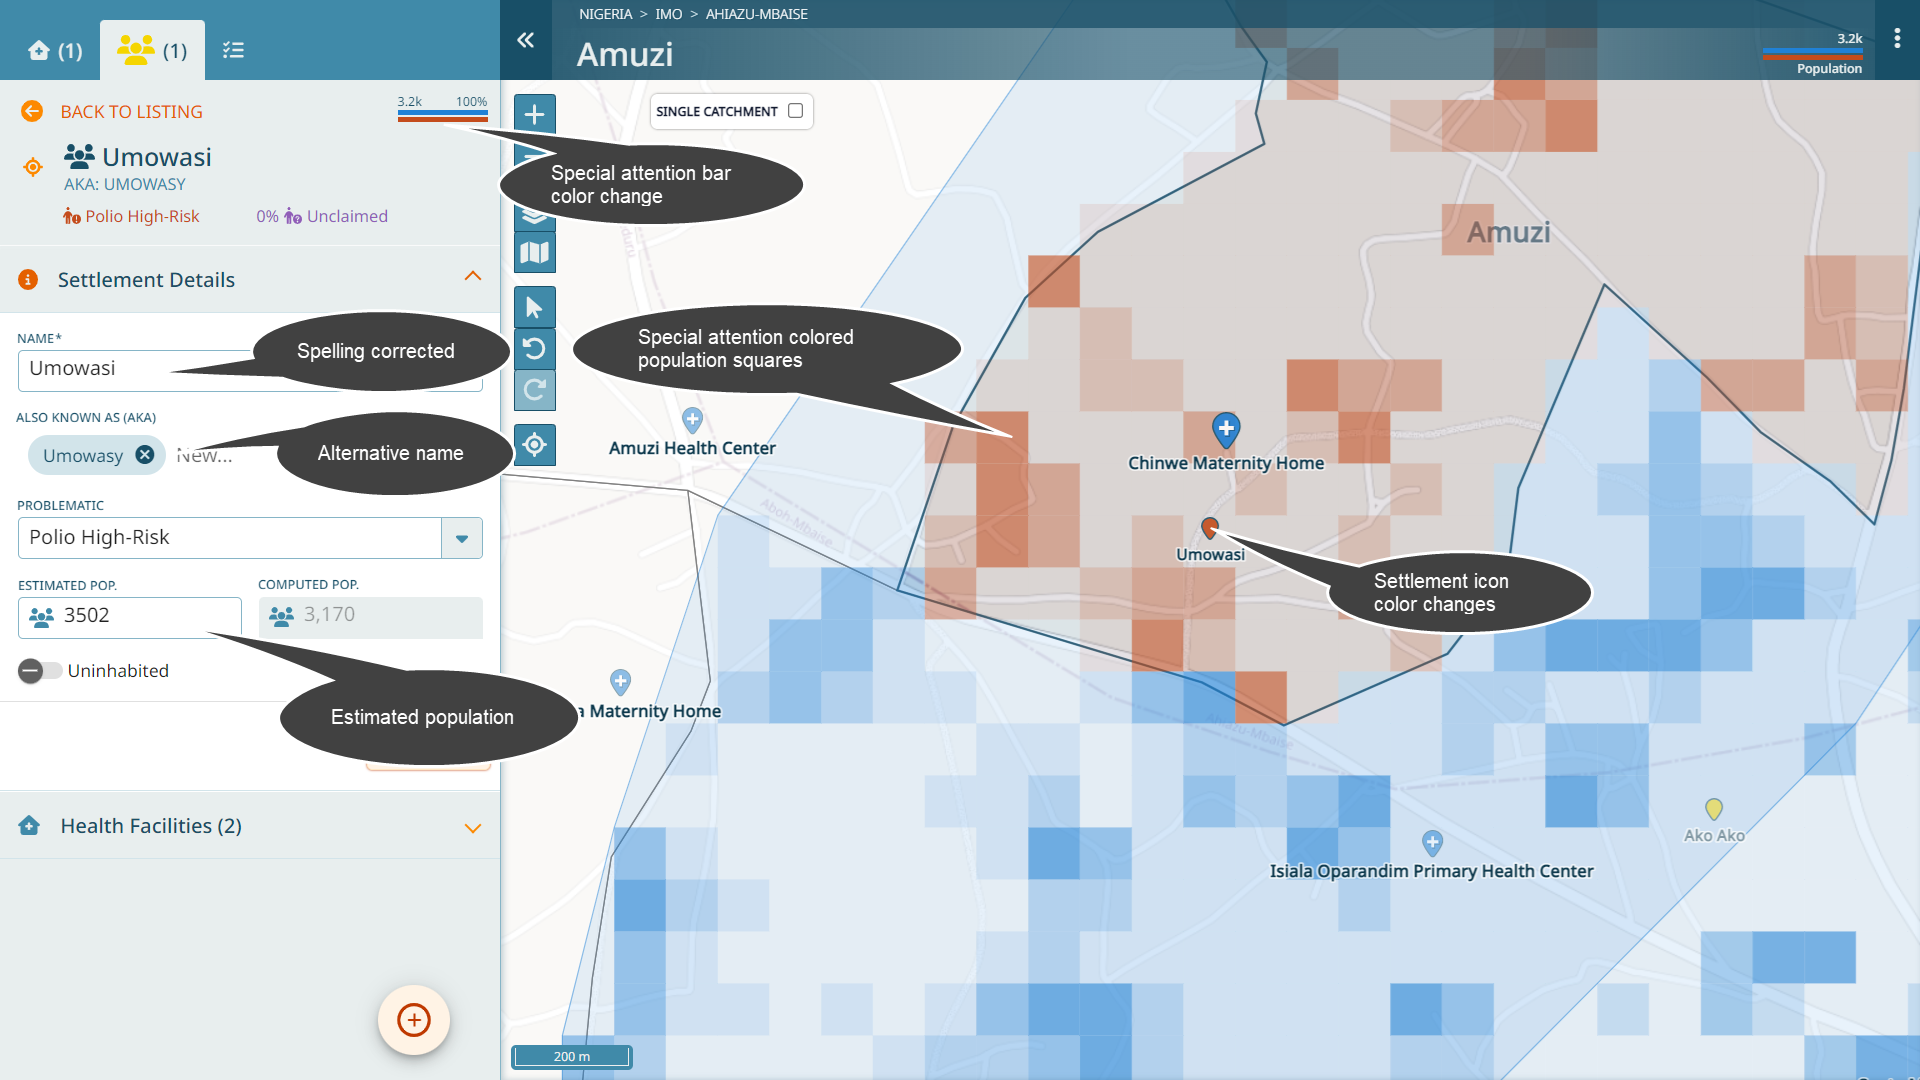
It has a typo, we should correct it to “Umowasi”
Some people refer to it as “Umowasy”
It is a polio high risk area
We know that there are 3502 people in this settlement
Note
Regarding poplulation: if you wonder where the computed population comes from, this is explained in Population.
Let’s update it accordingly.
Note
As a result of marking this settlement as polio high risk, we observe a few changes:
The population squares for this settlement have changed color since this settlement requires special attention
The settlement icon also changed color
The special attention bar has changed color
The reason for the settlement to require special attention is spelled out
Attention
The field estimated population is used only in the settlement detail - it does not show elsewhere. It is availble in the export, as we’ll see later. To remain consistent, all catchment calculations and population figures on the interface are using the computed population.
Click on ‘Back to listing’ on the top left. Note that the settlement name in the list also has changed color now due to it requiring special attention.
Hint
We reached our second goal: at this step, we imagine the settlement list for this ward is complete - all settlements we need to consider for this ward are on the list.
Review Microplanning
Navigate back to the health facility tab. Click on the health facility to expand the entry.
We can see that we have two settlements within our catchment. One requires special attention. Let’s see which two settlements are within our catchment. Click on ‘View Details’.
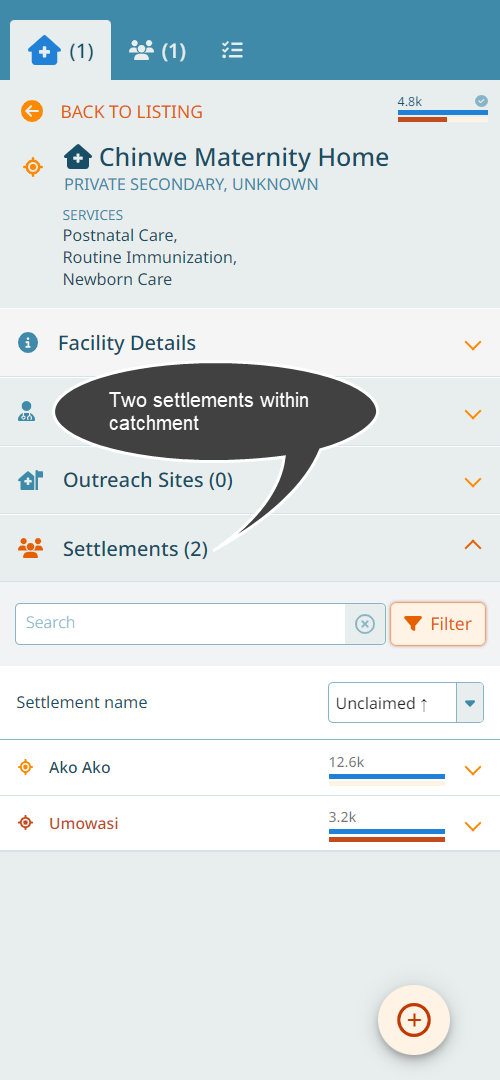
We can see the two settlements that are within the health facility catchment. You can locate the two settlements by clicking on the list entry - the icon on the map will become focused. You can also see that Ako Ako is covered by other health facilities by fixed post services.
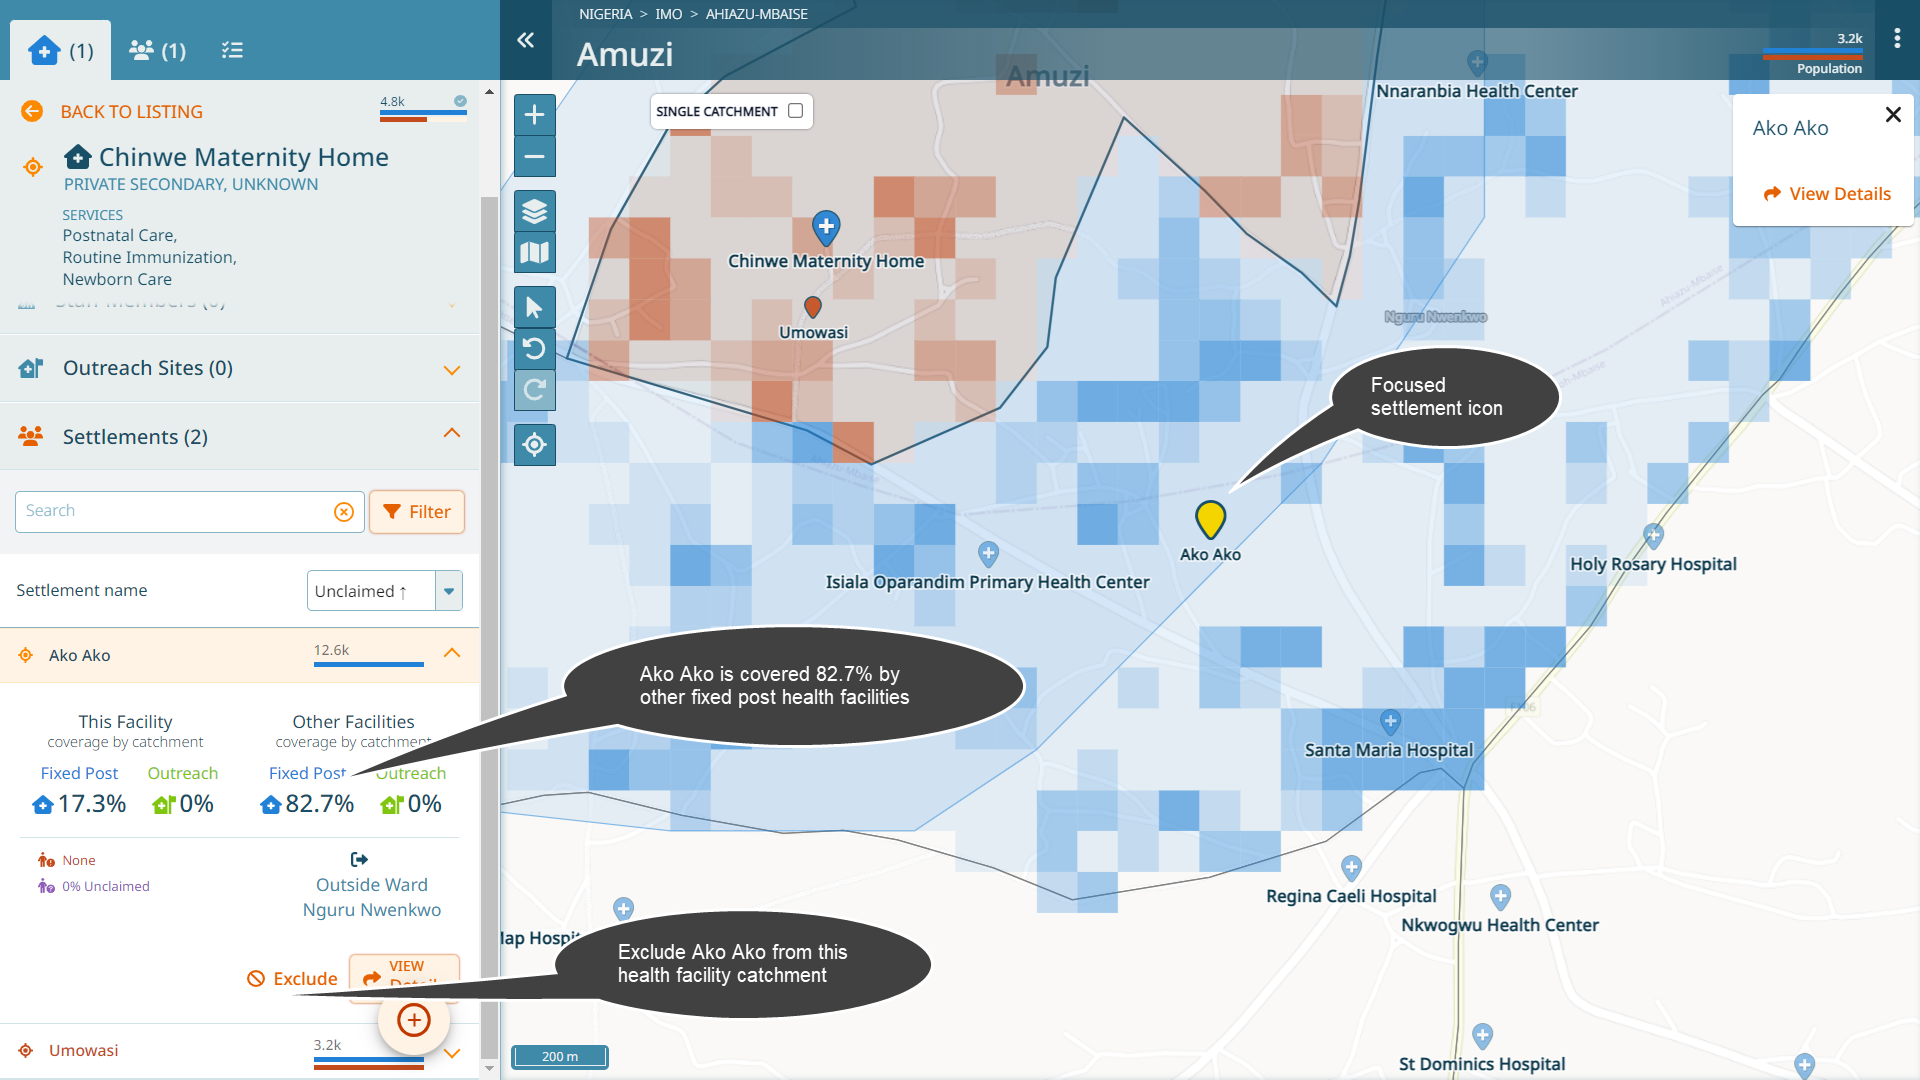
Exclusion of settlements
Let’s imagine that we know that nobody from Ako Ako is ever coming to our health facility. We can thus exclude this settlement from this health facility catchment. Click on ‘Exclude’.
This might also be something you would want to do when for instance a settlement is included in your health facility catchment but there are geographical obstacles (river, mountain) that prevent people from going to that health facility.
Note
The catchment of our health facility is now 2600, and there is a new section ‘Excluded Settlements’, you could re-include Ako Ako if you exclued it by mistake.
Hint
We reached our fourth goal: We reviewed the health facility and settlement list, we reviewed the catchments and our microplan is complete.
Mark health facility catchment as complete
Since we are now happy with our microplan for this health facility (and in this case that also means for this ward, since there is only one health facility), we will mark it as complete.
Navigate to the health facility details. Mark the health facility catchment status as complete.
Synchronize the changes back to the server
Hint
Our next goal is to synchronize our changes back to the server. This section is only relevant if you are on https://gmt-uat.novel-t.ch. It will not work for https://gmt-beta.novel-t.ch. Read the section nevertheless.
Warning
All of the current work has been saved in our browser locally. If we were to lose our device, those changes would be lost at the current stage. In order to update the GMT database with our changes, we will have to establish connectivity and synchronize our changes back with the server.
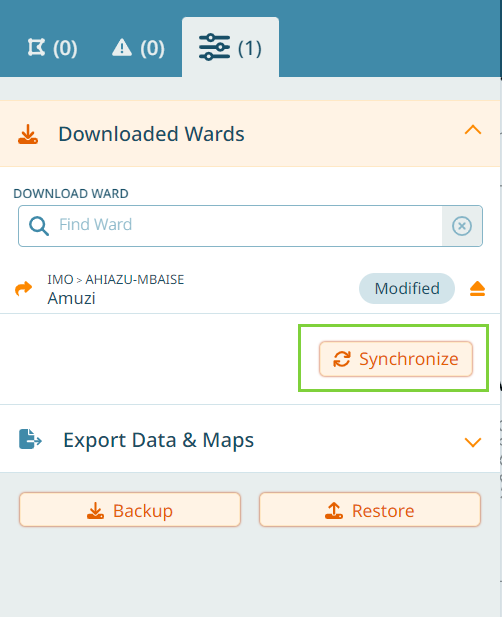
First, establish connectivity. Navigate to the ‘Downloaded wards’ section.
You will see that we modified the ward - it says ‘Modified’. Click on ‘Synchronize’.
Hint
We reached our fifth goal: synchronization has been achieved. Only one step left to finalize this tutorial.
Export the microplan
Hint
Our final goal for this first tutorial is the printing of the PDF and the export of an excel table with all the catchment information inside. Note, if you did not synchronize your changes, then the export will also not work.
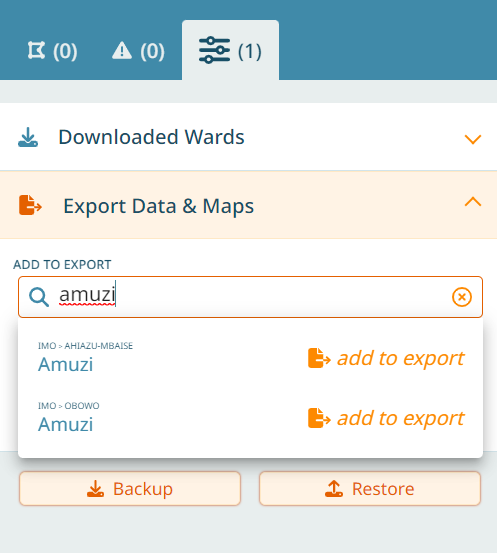
Below the section ‘Downloaded wards’, you find the section ‘Exoprt Data & Maps’. Click on it. Type the ward you want to export (in our case Amuzi).
You will have several options. If you export several wards at the same time, you can choose to just have one PDF file per ward (otherwise, it will generate one PDF containing the data for all wards). You can also choose to print a detail page per health facility. For our purpose, since we just have one ward anyway that we are working on, let’s just select the last option “Include one detailed page per Health Facility”. We also select ‘Export spreadsheet’.
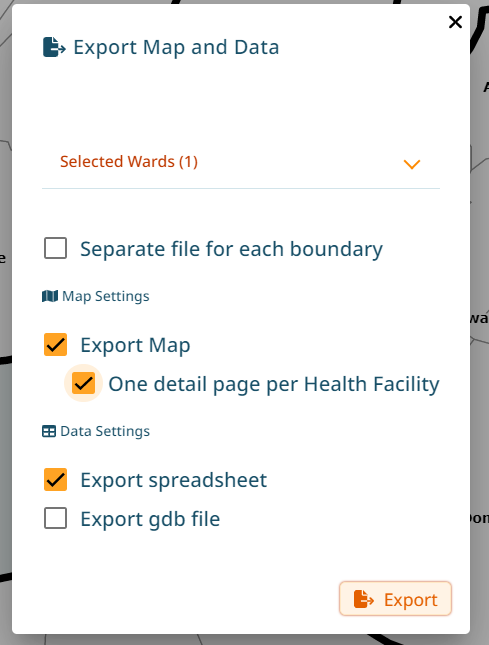
The export will be generated automatically. Open it and review it.
Important
You reached the end of Tutorial 1!